Immigrants from Lithuania vs Eastern European Child Poverty Under the Age of 5
COMPARE
Immigrants from Lithuania
Eastern European
Child Poverty Under the Age of 5
Child Poverty Under the Age of 5 Comparison
Immigrants from Lithuania
Eastern Europeans
14.1%
CHILD POVERTY UNDER THE AGE OF 5
99.9/ 100
METRIC RATING
26th/ 347
METRIC RANK
14.6%
CHILD POVERTY UNDER THE AGE OF 5
99.7/ 100
METRIC RATING
38th/ 347
METRIC RANK
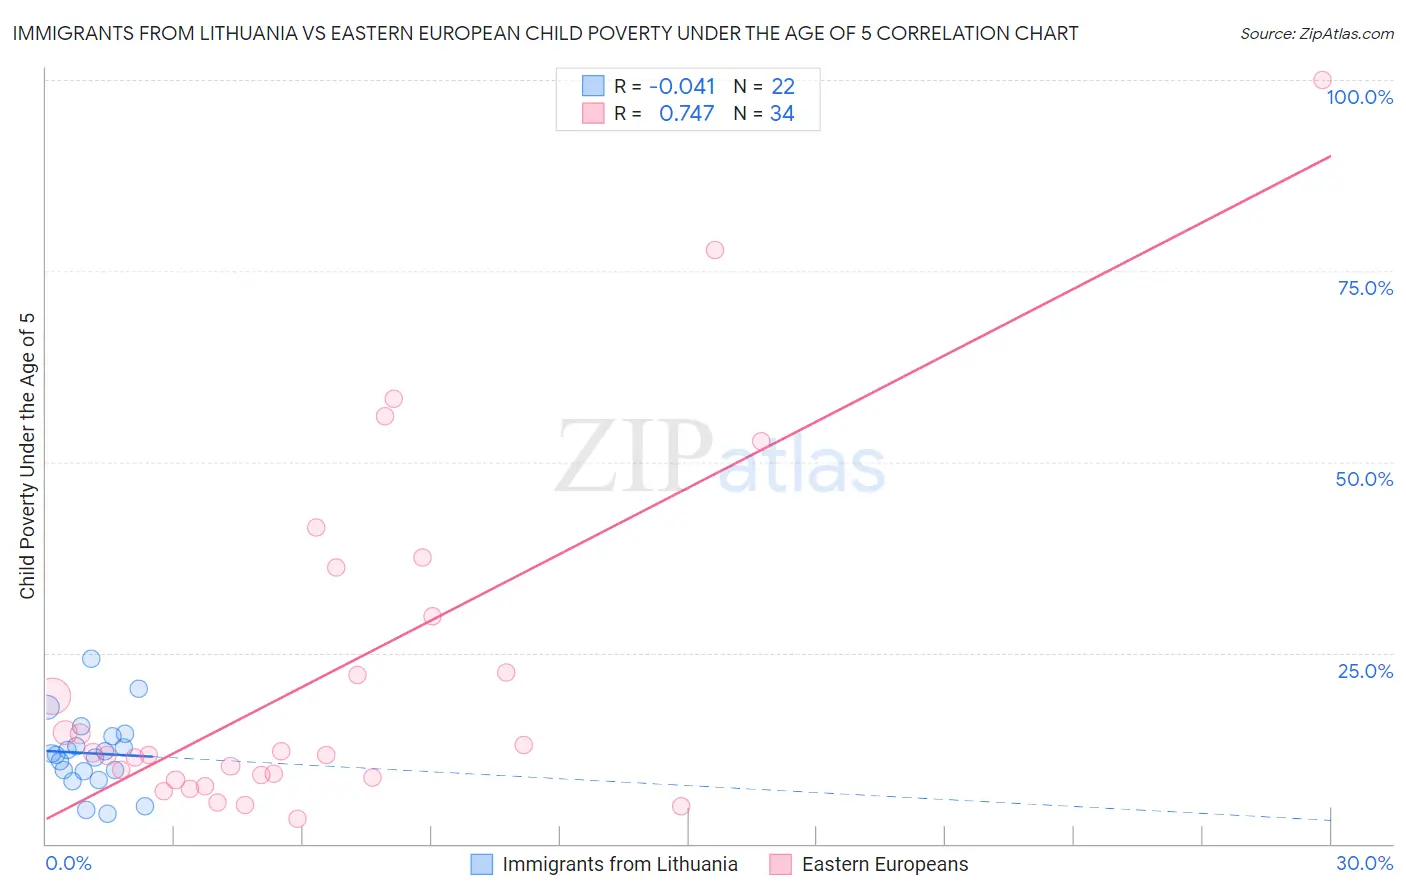
Immigrants from Lithuania vs Eastern European Child Poverty Under the Age of 5 Correlation Chart
The statistical analysis conducted on geographies consisting of 114,250,981 people shows no correlation between the proportion of Immigrants from Lithuania and poverty level among children under the age of 5 in the United States with a correlation coefficient (R) of -0.041 and weighted average of 14.1%. Similarly, the statistical analysis conducted on geographies consisting of 434,780,040 people shows a strong positive correlation between the proportion of Eastern Europeans and poverty level among children under the age of 5 in the United States with a correlation coefficient (R) of 0.747 and weighted average of 14.6%, a difference of 3.6%.
Child Poverty Under the Age of 5 Correlation Summary
| Measurement | Immigrants from Lithuania | Eastern European |
| Minimum | 3.9% | 3.2% |
| Maximum | 24.3% | 100.0% |
| Range | 20.4% | 96.8% |
| Mean | 11.8% | 22.4% |
| Median | 11.7% | 11.7% |
| Interquartile 25% (IQ1) | 9.6% | 8.7% |
| Interquartile 75% (IQ3) | 14.1% | 29.8% |
| Interquartile Range (IQR) | 4.5% | 21.0% |
| Standard Deviation (Sample) | 4.9% | 22.8% |
| Standard Deviation (Population) | 4.8% | 22.5% |
Demographics Similar to Immigrants from Lithuania and Eastern Europeans by Child Poverty Under the Age of 5
In terms of child poverty under the age of 5, the demographic groups most similar to Immigrants from Lithuania are Tongan (14.2%, a difference of 0.49%), Asian (14.0%, a difference of 0.93%), Cypriot (14.0%, a difference of 0.93%), Bulgarian (13.9%, a difference of 1.5%), and Immigrants from Indonesia (14.3%, a difference of 1.7%). Similarly, the demographic groups most similar to Eastern Europeans are Norwegian (14.6%, a difference of 0.0%), Turkish (14.6%, a difference of 0.27%), Immigrants from Australia (14.6%, a difference of 0.29%), Immigrants from Belarus (14.7%, a difference of 0.41%), and Soviet Union (14.7%, a difference of 0.57%).
| Demographics | Rating | Rank | Child Poverty Under the Age of 5 |
| Immigrants | Bolivia | 100.0 /100 | #22 | Exceptional 13.8% |
| Bulgarians | 99.9 /100 | #23 | Exceptional 13.9% |
| Asians | 99.9 /100 | #24 | Exceptional 14.0% |
| Cypriots | 99.9 /100 | #25 | Exceptional 14.0% |
| Immigrants | Lithuania | 99.9 /100 | #26 | Exceptional 14.1% |
| Tongans | 99.9 /100 | #27 | Exceptional 14.2% |
| Immigrants | Indonesia | 99.8 /100 | #28 | Exceptional 14.3% |
| Immigrants | Asia | 99.8 /100 | #29 | Exceptional 14.4% |
| Cambodians | 99.8 /100 | #30 | Exceptional 14.4% |
| Koreans | 99.8 /100 | #31 | Exceptional 14.4% |
| Immigrants | Sri Lanka | 99.8 /100 | #32 | Exceptional 14.4% |
| Taiwanese | 99.8 /100 | #33 | Exceptional 14.5% |
| Immigrants | Moldova | 99.8 /100 | #34 | Exceptional 14.5% |
| Latvians | 99.8 /100 | #35 | Exceptional 14.5% |
| Maltese | 99.8 /100 | #36 | Exceptional 14.5% |
| Turks | 99.7 /100 | #37 | Exceptional 14.6% |
| Eastern Europeans | 99.7 /100 | #38 | Exceptional 14.6% |
| Norwegians | 99.7 /100 | #39 | Exceptional 14.6% |
| Immigrants | Australia | 99.7 /100 | #40 | Exceptional 14.6% |
| Immigrants | Belarus | 99.7 /100 | #41 | Exceptional 14.7% |
| Soviet Union | 99.7 /100 | #42 | Exceptional 14.7% |