Immigrants from Lithuania vs Alaskan Athabascan Child Poverty Under the Age of 5
COMPARE
Immigrants from Lithuania
Alaskan Athabascan
Child Poverty Under the Age of 5
Child Poverty Under the Age of 5 Comparison
Immigrants from Lithuania
Alaskan Athabascans
14.1%
CHILD POVERTY UNDER THE AGE OF 5
99.9/ 100
METRIC RATING
26th/ 347
METRIC RANK
21.8%
CHILD POVERTY UNDER THE AGE OF 5
0.0/ 100
METRIC RATING
300th/ 347
METRIC RANK
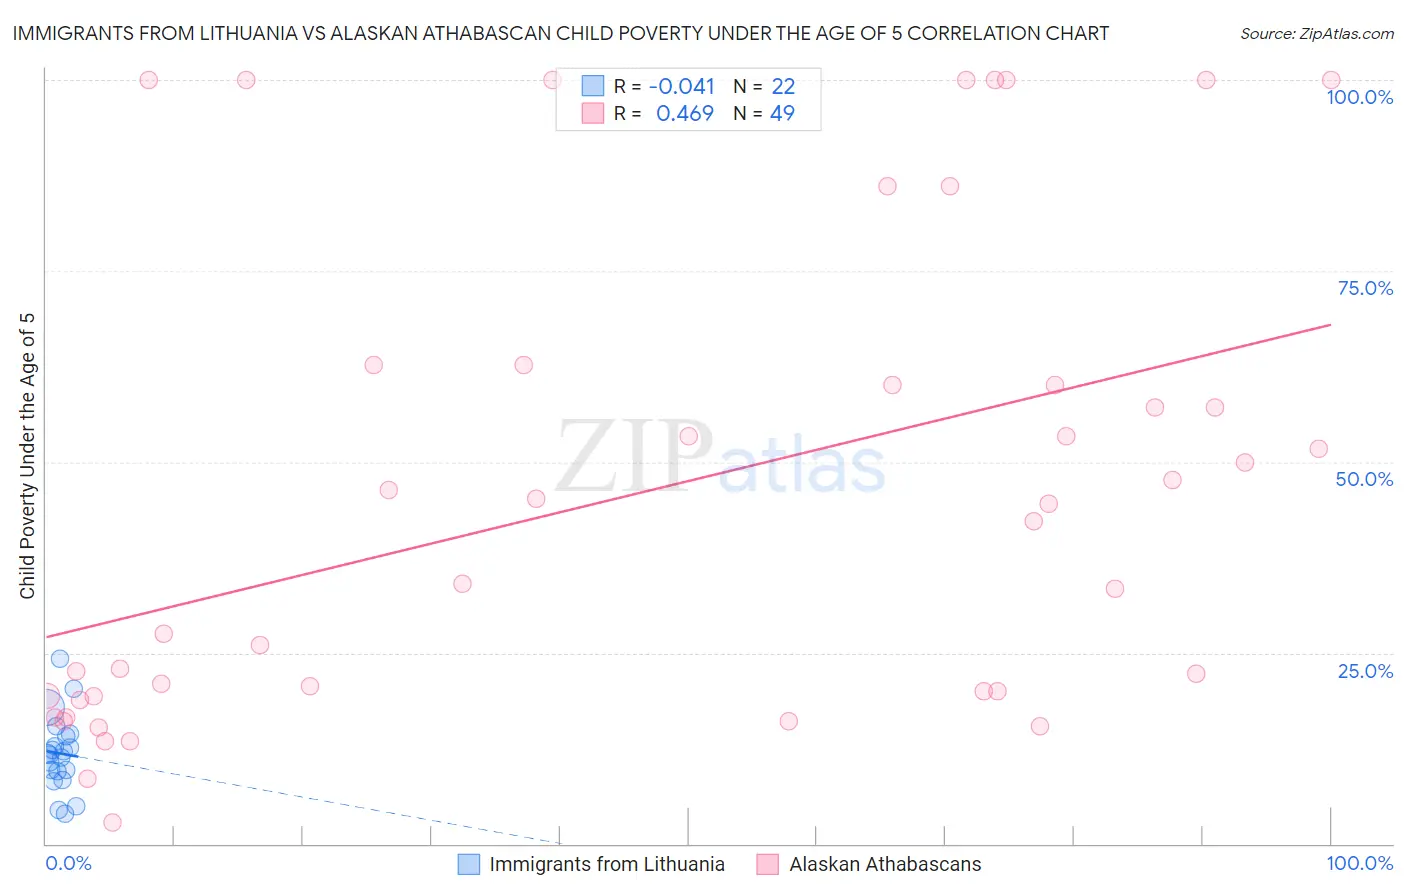
Immigrants from Lithuania vs Alaskan Athabascan Child Poverty Under the Age of 5 Correlation Chart
The statistical analysis conducted on geographies consisting of 114,250,981 people shows no correlation between the proportion of Immigrants from Lithuania and poverty level among children under the age of 5 in the United States with a correlation coefficient (R) of -0.041 and weighted average of 14.1%. Similarly, the statistical analysis conducted on geographies consisting of 45,439,676 people shows a moderate positive correlation between the proportion of Alaskan Athabascans and poverty level among children under the age of 5 in the United States with a correlation coefficient (R) of 0.469 and weighted average of 21.8%, a difference of 54.8%.
Child Poverty Under the Age of 5 Correlation Summary
| Measurement | Immigrants from Lithuania | Alaskan Athabascan |
| Minimum | 3.9% | 2.7% |
| Maximum | 24.3% | 100.0% |
| Range | 20.4% | 97.3% |
| Mean | 11.8% | 45.5% |
| Median | 11.7% | 42.3% |
| Interquartile 25% (IQ1) | 9.6% | 19.3% |
| Interquartile 75% (IQ3) | 14.1% | 61.3% |
| Interquartile Range (IQR) | 4.5% | 42.0% |
| Standard Deviation (Sample) | 4.9% | 31.0% |
| Standard Deviation (Population) | 4.8% | 30.7% |
Similar Demographics by Child Poverty Under the Age of 5
Demographics Similar to Immigrants from Lithuania by Child Poverty Under the Age of 5
In terms of child poverty under the age of 5, the demographic groups most similar to Immigrants from Lithuania are Tongan (14.2%, a difference of 0.49%), Asian (14.0%, a difference of 0.93%), Cypriot (14.0%, a difference of 0.93%), Bulgarian (13.9%, a difference of 1.5%), and Immigrants from Indonesia (14.3%, a difference of 1.7%).
| Demographics | Rating | Rank | Child Poverty Under the Age of 5 |
| Immigrants | Ireland | 100.0 /100 | #19 | Exceptional 13.7% |
| Immigrants | Japan | 100.0 /100 | #20 | Exceptional 13.8% |
| Bolivians | 100.0 /100 | #21 | Exceptional 13.8% |
| Immigrants | Bolivia | 100.0 /100 | #22 | Exceptional 13.8% |
| Bulgarians | 99.9 /100 | #23 | Exceptional 13.9% |
| Asians | 99.9 /100 | #24 | Exceptional 14.0% |
| Cypriots | 99.9 /100 | #25 | Exceptional 14.0% |
| Immigrants | Lithuania | 99.9 /100 | #26 | Exceptional 14.1% |
| Tongans | 99.9 /100 | #27 | Exceptional 14.2% |
| Immigrants | Indonesia | 99.8 /100 | #28 | Exceptional 14.3% |
| Immigrants | Asia | 99.8 /100 | #29 | Exceptional 14.4% |
| Cambodians | 99.8 /100 | #30 | Exceptional 14.4% |
| Koreans | 99.8 /100 | #31 | Exceptional 14.4% |
| Immigrants | Sri Lanka | 99.8 /100 | #32 | Exceptional 14.4% |
| Taiwanese | 99.8 /100 | #33 | Exceptional 14.5% |
Demographics Similar to Alaskan Athabascans by Child Poverty Under the Age of 5
In terms of child poverty under the age of 5, the demographic groups most similar to Alaskan Athabascans are Blackfeet (21.8%, a difference of 0.010%), Chickasaw (21.8%, a difference of 0.010%), Hispanic or Latino (21.7%, a difference of 0.40%), Yaqui (21.7%, a difference of 0.41%), and Cherokee (21.7%, a difference of 0.57%).
| Demographics | Rating | Rank | Child Poverty Under the Age of 5 |
| Mexicans | 0.0 /100 | #293 | Tragic 21.6% |
| Guatemalans | 0.0 /100 | #294 | Tragic 21.6% |
| Cherokee | 0.0 /100 | #295 | Tragic 21.7% |
| Yaqui | 0.0 /100 | #296 | Tragic 21.7% |
| Hispanics or Latinos | 0.0 /100 | #297 | Tragic 21.7% |
| Blackfeet | 0.0 /100 | #298 | Tragic 21.8% |
| Chickasaw | 0.0 /100 | #299 | Tragic 21.8% |
| Alaskan Athabascans | 0.0 /100 | #300 | Tragic 21.8% |
| Immigrants | Central America | 0.0 /100 | #301 | Tragic 22.0% |
| Iroquois | 0.0 /100 | #302 | Tragic 22.0% |
| Inupiat | 0.0 /100 | #303 | Tragic 22.0% |
| Immigrants | Guatemala | 0.0 /100 | #304 | Tragic 22.0% |
| Immigrants | Mexico | 0.0 /100 | #305 | Tragic 22.2% |
| Indonesians | 0.0 /100 | #306 | Tragic 22.3% |
| Immigrants | Bahamas | 0.0 /100 | #307 | Tragic 22.7% |