Macedonian vs Alaskan Athabascan Child Poverty Under the Age of 5
COMPARE
Macedonian
Alaskan Athabascan
Child Poverty Under the Age of 5
Child Poverty Under the Age of 5 Comparison
Macedonians
Alaskan Athabascans
15.8%
CHILD POVERTY UNDER THE AGE OF 5
96.2/ 100
METRIC RATING
97th/ 347
METRIC RANK
21.8%
CHILD POVERTY UNDER THE AGE OF 5
0.0/ 100
METRIC RATING
300th/ 347
METRIC RANK
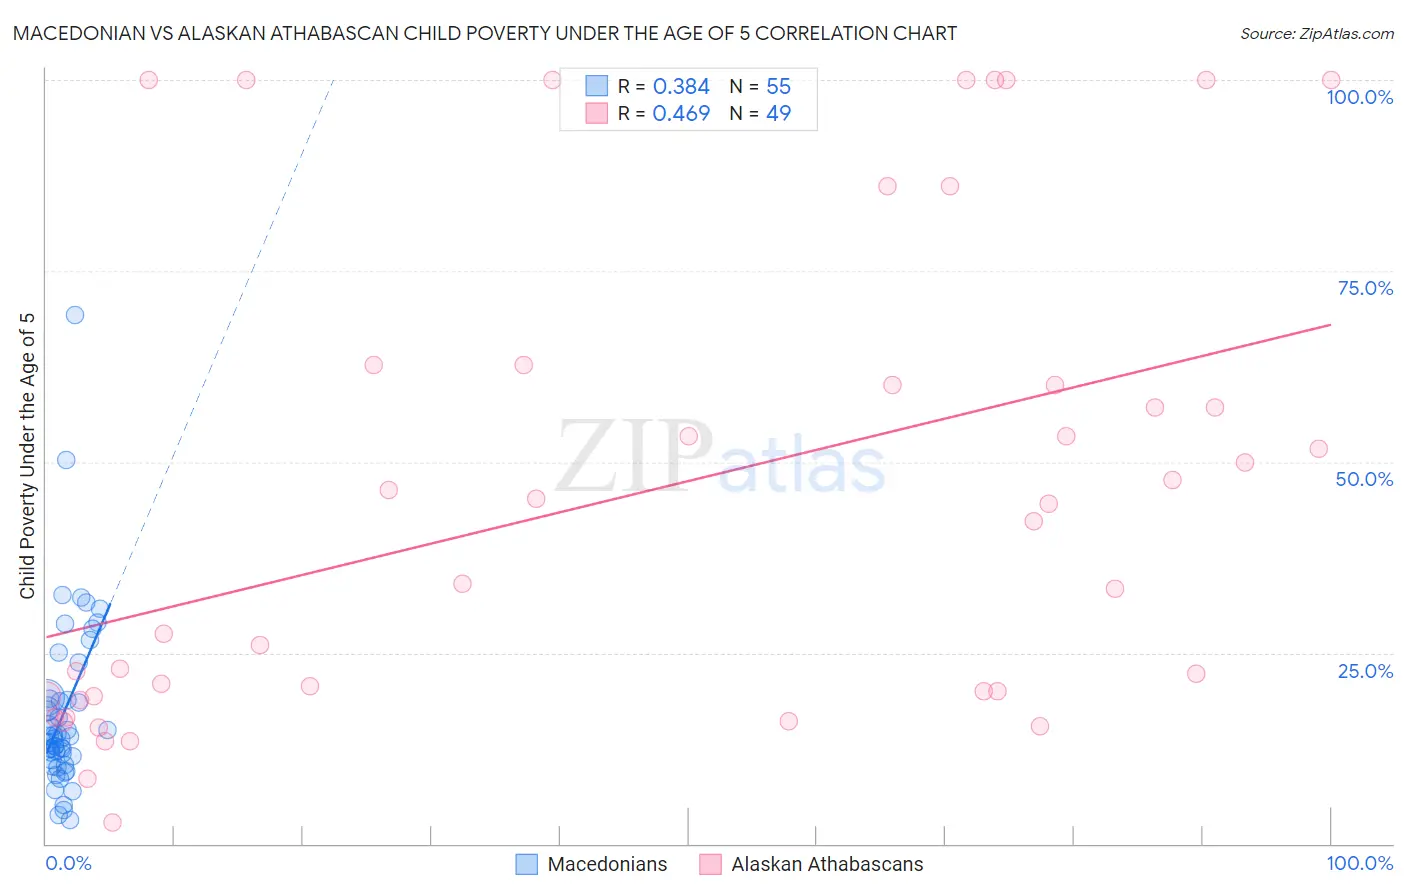
Macedonian vs Alaskan Athabascan Child Poverty Under the Age of 5 Correlation Chart
The statistical analysis conducted on geographies consisting of 129,119,127 people shows a mild positive correlation between the proportion of Macedonians and poverty level among children under the age of 5 in the United States with a correlation coefficient (R) of 0.384 and weighted average of 15.8%. Similarly, the statistical analysis conducted on geographies consisting of 45,439,676 people shows a moderate positive correlation between the proportion of Alaskan Athabascans and poverty level among children under the age of 5 in the United States with a correlation coefficient (R) of 0.469 and weighted average of 21.8%, a difference of 38.2%.
Child Poverty Under the Age of 5 Correlation Summary
| Measurement | Macedonian | Alaskan Athabascan |
| Minimum | 3.1% | 2.7% |
| Maximum | 69.2% | 100.0% |
| Range | 66.1% | 97.3% |
| Mean | 17.1% | 45.5% |
| Median | 14.1% | 42.3% |
| Interquartile 25% (IQ1) | 11.0% | 19.3% |
| Interquartile 75% (IQ3) | 19.0% | 61.3% |
| Interquartile Range (IQR) | 7.9% | 42.0% |
| Standard Deviation (Sample) | 11.3% | 31.0% |
| Standard Deviation (Population) | 11.2% | 30.7% |
Similar Demographics by Child Poverty Under the Age of 5
Demographics Similar to Macedonians by Child Poverty Under the Age of 5
In terms of child poverty under the age of 5, the demographic groups most similar to Macedonians are Immigrants from Kazakhstan (15.8%, a difference of 0.040%), Immigrants from South Africa (15.8%, a difference of 0.070%), Immigrants from Switzerland (15.8%, a difference of 0.17%), Palestinian (15.8%, a difference of 0.18%), and Immigrants from Canada (15.8%, a difference of 0.20%).
| Demographics | Rating | Rank | Child Poverty Under the Age of 5 |
| Immigrants | France | 97.3 /100 | #90 | Exceptional 15.6% |
| Poles | 97.2 /100 | #91 | Exceptional 15.7% |
| Scandinavians | 97.1 /100 | #92 | Exceptional 15.7% |
| Ukrainians | 97.1 /100 | #93 | Exceptional 15.7% |
| Immigrants | South Eastern Asia | 97.1 /100 | #94 | Exceptional 15.7% |
| Immigrants | Switzerland | 96.4 /100 | #95 | Exceptional 15.8% |
| Immigrants | Kazakhstan | 96.2 /100 | #96 | Exceptional 15.8% |
| Macedonians | 96.2 /100 | #97 | Exceptional 15.8% |
| Immigrants | South Africa | 96.1 /100 | #98 | Exceptional 15.8% |
| Palestinians | 95.9 /100 | #99 | Exceptional 15.8% |
| Immigrants | Canada | 95.9 /100 | #100 | Exceptional 15.8% |
| Immigrants | Zimbabwe | 95.9 /100 | #101 | Exceptional 15.8% |
| Armenians | 95.7 /100 | #102 | Exceptional 15.8% |
| Europeans | 95.3 /100 | #103 | Exceptional 15.9% |
| Immigrants | North America | 94.9 /100 | #104 | Exceptional 15.9% |
Demographics Similar to Alaskan Athabascans by Child Poverty Under the Age of 5
In terms of child poverty under the age of 5, the demographic groups most similar to Alaskan Athabascans are Blackfeet (21.8%, a difference of 0.010%), Chickasaw (21.8%, a difference of 0.010%), Hispanic or Latino (21.7%, a difference of 0.40%), Yaqui (21.7%, a difference of 0.41%), and Cherokee (21.7%, a difference of 0.57%).
| Demographics | Rating | Rank | Child Poverty Under the Age of 5 |
| Mexicans | 0.0 /100 | #293 | Tragic 21.6% |
| Guatemalans | 0.0 /100 | #294 | Tragic 21.6% |
| Cherokee | 0.0 /100 | #295 | Tragic 21.7% |
| Yaqui | 0.0 /100 | #296 | Tragic 21.7% |
| Hispanics or Latinos | 0.0 /100 | #297 | Tragic 21.7% |
| Blackfeet | 0.0 /100 | #298 | Tragic 21.8% |
| Chickasaw | 0.0 /100 | #299 | Tragic 21.8% |
| Alaskan Athabascans | 0.0 /100 | #300 | Tragic 21.8% |
| Immigrants | Central America | 0.0 /100 | #301 | Tragic 22.0% |
| Iroquois | 0.0 /100 | #302 | Tragic 22.0% |
| Inupiat | 0.0 /100 | #303 | Tragic 22.0% |
| Immigrants | Guatemala | 0.0 /100 | #304 | Tragic 22.0% |
| Immigrants | Mexico | 0.0 /100 | #305 | Tragic 22.2% |
| Indonesians | 0.0 /100 | #306 | Tragic 22.3% |
| Immigrants | Bahamas | 0.0 /100 | #307 | Tragic 22.7% |