Immigrants vs Immigrants from Afghanistan Female Poverty Among 18-24 Year Olds

COMPARE

Immigrants
Race
Ancestry
AfghanAfricanAlaska NativeAlaskan AthabascanAlbanianAleutAlsatianAmericanApacheArabArapahoArgentineanArmenianAssyrian/Chaldean/SyriacAustralianAustrianBahamianBangladeshiBarbadianBasqueBelgianBelizeanBermudanBhutaneseBlackfeetBolivianBrazilianBritishBritish West IndianBulgarianBurmeseCajunCambodianCanadianCape VerdeanCarpatho RusynCelticCentral AmericanCentral American IndianCherokeeCheyenneChickasawChileanChineseChippewaChoctawColombianColvilleComancheCosta RicanCreeCreekCroatianCrowCubanCypriotCzechCzechoslovakianDanishDelawareDominicanDutchDutch West IndianEastern EuropeanEcuadorianEgyptianEnglishEstonianEthiopianEuropeanFijianFilipinoFinnishFrenchFrench American IndianFrench CanadianGermanGerman RussianGhanaianGreekGuamanian/ChamorroGuatemalanGuyaneseHaitianHmongHonduranHopiHoumaHungarianIcelanderIndian (Asian)IndonesianInupiatIranianIraqiIrishIroquoisIsraeliItalianJamaicanJapaneseJordanianKenyanKiowaKoreanLaotianLatvianLebaneseLiberianLithuanianLumbeeLuxembourgerMacedonianMalaysianMalteseMarshalleseMenomineeMexicanMexican American IndianMongolianMoroccanNative HawaiianNavajoNepaleseNew ZealanderNicaraguanNigerianNorthern EuropeanNorwegianOkinawanOsageOttawaPaiutePakistaniPalestinianPanamanianParaguayanPennsylvania GermanPeruvianPimaPolishPortuguesePotawatomiPuebloPuerto RicanPuget Sound SalishRomanianRussianSalvadoranSamoanScandinavianScotch-IrishScottishSeminoleSenegaleseSerbianShoshoneSierra LeoneanSiouxSlavicSlovakSloveneSomaliSouth AfricanSouth AmericanSouth American IndianSoviet UnionSpaniardSpanishSpanish AmericanSpanish American IndianSri LankanSubsaharan AfricanSudaneseSwedishSwissSyrianTaiwaneseThaiTlingit-HaidaTohono O'OdhamTonganTrinidadian and TobagonianTsimshianTurkishU.S. Virgin IslanderUgandanUkrainianUruguayanUteVenezuelanVietnameseWelshWest IndianYakamaYaquiYugoslavianYumanYup'ikZimbabwean
Immigration
NonimmigrantsImmigrantsAfricaAlbaniaArgentinaArmeniaAsiaAustraliaAustriaBahamasBangladeshBarbadosBelarusBelgiumBelizeBoliviaBosnia and HerzegovinaBrazilBulgariaBurma/MyanmarCabo VerdeCambodiaCameroonCanadaCaribbeanCentral AmericaChileChinaColombiaCongoCosta RicaCroatiaCubaCzechoslovakiaDenmarkDominicaDominican RepublicEastern AfricaEastern AsiaEastern EuropeEcuadorEgyptEl SalvadorEnglandEritreaEthiopiaEuropeFijiFranceGermanyGhanaGreeceGrenadaGuatemalaGuyanaHaitiHondurasHong KongHungaryIndiaIndonesiaIranIraqIrelandIsraelItalyJamaicaJapanJordanKazakhstanKenyaKoreaKuwaitLaosLatin AmericaLatviaLebanonLiberiaLithuaniaMalaysiaMexicoMicronesiaMiddle AfricaMoldovaMoroccoNepalNetherlandsNicaraguaNigeriaNorth AmericaNorth MacedoniaNorthern AfricaNorthern EuropeNorwayOceaniaPakistanPanamaPeruPhilippinesPolandPortugalRomaniaRussiaSaudi ArabiaScotlandSenegalSerbiaSierra LeoneSingaporeSomaliaSouth AfricaSouth AmericaSouth Central AsiaSouth Eastern AsiaSouthern EuropeSpainSri LankaSt. Vincent and the GrenadinesSudanSwedenSwitzerlandSyriaTaiwanThailandTrinidad and TobagoTurkeyUgandaUkraineUruguayUzbekistanVenezuelaVietnamWest IndiesWestern AfricaWestern AsiaWestern EuropeYemenZaireZimbabweAzores
Immigrants from Afghanistan
Race
Ancestry
AfghanAfricanAlaska NativeAlaskan AthabascanAlbanianAleutAlsatianAmericanApacheArabArapahoArgentineanArmenianAssyrian/Chaldean/SyriacAustralianAustrianBahamianBangladeshiBarbadianBasqueBelgianBelizeanBermudanBhutaneseBlackfeetBolivianBrazilianBritishBritish West IndianBulgarianBurmeseCajunCambodianCanadianCape VerdeanCarpatho RusynCelticCentral AmericanCentral American IndianCherokeeCheyenneChickasawChileanChineseChippewaChoctawColombianColvilleComancheCosta RicanCreeCreekCroatianCrowCubanCypriotCzechCzechoslovakianDanishDelawareDominicanDutchDutch West IndianEastern EuropeanEcuadorianEgyptianEnglishEstonianEthiopianEuropeanFijianFilipinoFinnishFrenchFrench American IndianFrench CanadianGermanGerman RussianGhanaianGreekGuamanian/ChamorroGuatemalanGuyaneseHaitianHmongHonduranHopiHoumaHungarianIcelanderIndian (Asian)IndonesianInupiatIranianIraqiIrishIroquoisIsraeliItalianJamaicanJapaneseJordanianKenyanKiowaKoreanLaotianLatvianLebaneseLiberianLithuanianLumbeeLuxembourgerMacedonianMalaysianMalteseMarshalleseMenomineeMexicanMexican American IndianMongolianMoroccanNative HawaiianNavajoNepaleseNew ZealanderNicaraguanNigerianNorthern EuropeanNorwegianOkinawanOsageOttawaPaiutePakistaniPalestinianPanamanianParaguayanPennsylvania GermanPeruvianPimaPolishPortuguesePotawatomiPuebloPuerto RicanPuget Sound SalishRomanianRussianSalvadoranSamoanScandinavianScotch-IrishScottishSeminoleSenegaleseSerbianShoshoneSierra LeoneanSiouxSlavicSlovakSloveneSomaliSouth AfricanSouth AmericanSouth American IndianSoviet UnionSpaniardSpanishSpanish AmericanSpanish American IndianSri LankanSubsaharan AfricanSudaneseSwedishSwissSyrianTaiwaneseThaiTlingit-HaidaTohono O'OdhamTonganTrinidadian and TobagonianTsimshianTurkishU.S. Virgin IslanderUgandanUkrainianUruguayanUteVenezuelanVietnameseWelshWest IndianYakamaYaquiYugoslavianYumanYup'ikZimbabwean
Immigration
NonimmigrantsAfghanistanAfricaAlbaniaArgentinaArmeniaAsiaAustraliaAustriaBahamasBangladeshBarbadosBelarusBelgiumBelizeBoliviaBosnia and HerzegovinaBrazilBulgariaBurma/MyanmarCabo VerdeCambodiaCameroonCanadaCaribbeanCentral AmericaChileChinaColombiaCongoCosta RicaCroatiaCubaCzechoslovakiaDenmarkDominicaDominican RepublicEastern AfricaEastern AsiaEastern EuropeEcuadorEgyptEl SalvadorEnglandEritreaEthiopiaEuropeFijiFranceGermanyGhanaGreeceGrenadaGuatemalaGuyanaHaitiHondurasHong KongHungaryIndiaIndonesiaIranIraqIrelandIsraelItalyJamaicaJapanJordanKazakhstanKenyaKoreaKuwaitLaosLatin AmericaLatviaLebanonLiberiaLithuaniaMalaysiaMexicoMicronesiaMiddle AfricaMoldovaMoroccoNepalNetherlandsNicaraguaNigeriaNorth AmericaNorth MacedoniaNorthern AfricaNorthern EuropeNorwayOceaniaPakistanPanamaPeruPhilippinesPolandPortugalRomaniaRussiaSaudi ArabiaScotlandSenegalSerbiaSierra LeoneSingaporeSomaliaSouth AfricaSouth AmericaSouth Central AsiaSouth Eastern AsiaSouthern EuropeSpainSri LankaSt. Vincent and the GrenadinesSudanSwedenSwitzerlandSyriaTaiwanThailandTrinidad and TobagoTurkeyUgandaUkraineUruguayUzbekistanVenezuelaVietnamWest IndiesWestern AfricaWestern AsiaWestern EuropeYemenZaireZimbabweAzores
Female Poverty Among 18-24 Year Olds
Income
Poverty
Unemployment
Labor Participation
Family Structure
Vehicle Availability
Education Level
Disability

Female Poverty Among 18-24 Year Olds Comparison

Immigrants

Immigrants from Afghanistan

Exceptional
Exceptional
19.3%
FEMALE POVERTY AMONG 18-24 YEAR OLDS
95.9/ 100
METRIC RATING
116th/ 347
METRIC RANK
19.1%
FEMALE POVERTY AMONG 18-24 YEAR OLDS
98.0/ 100
METRIC RATING
104th/ 347
METRIC RANK

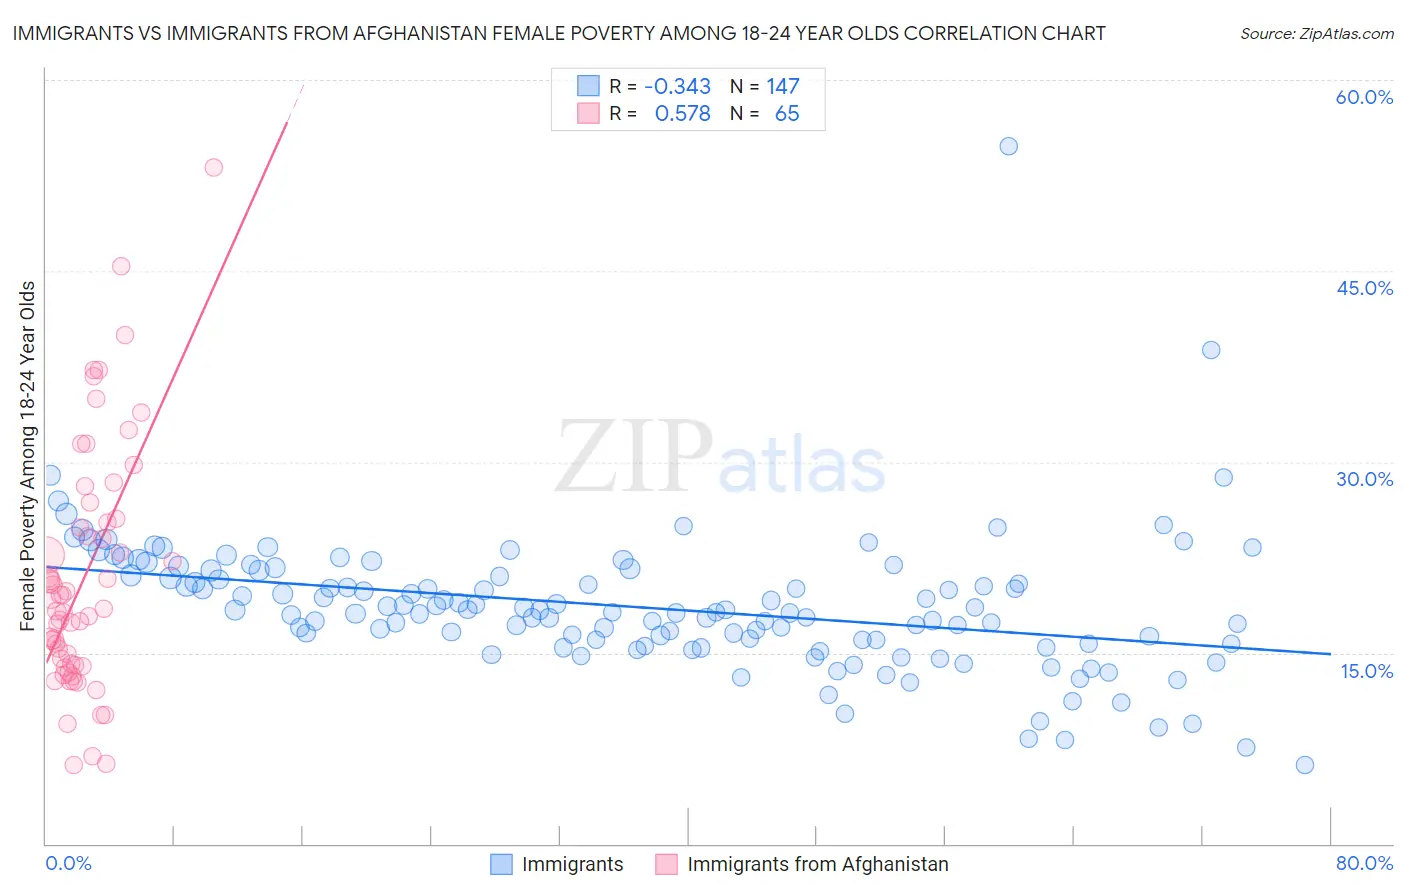
Immigrants vs Immigrants from Afghanistan Female Poverty Among 18-24 Year Olds Correlation Chart

The statistical analysis conducted on geographies consisting of 542,481,835 people shows a mild negative correlation between the proportion of Immigrants and poverty level among females between the ages 18 and 24 in the United States with a correlation coefficient (R) of -0.343 and weighted average of 19.3%. Similarly, the statistical analysis conducted on geographies consisting of 146,633,346 people shows a substantial positive correlation between the proportion of Immigrants from Afghanistan and poverty level among females between the ages 18 and 24 in the United States with a correlation coefficient (R) of 0.578 and weighted average of 19.1%, a difference of 0.94%.
Immigrants vs Immigrants from Afghanistan Female Poverty Among 18-24 Year Olds

Female Poverty Among 18-24 Year Olds Correlation Summary

MeasurementImmigrantsImmigrants from Afghanistan
Minimum6.2%6.2%
Maximum54.8%53.1%
Range48.6%46.9%
Mean18.6%20.9%
Median18.2%18.4%
Interquartile 25% (IQ1)15.7%14.0%
Interquartile 75% (IQ3)21.1%25.4%
Interquartile Range (IQR)5.4%11.4%
Standard Deviation (Sample)5.4%9.5%
Standard Deviation (Population)5.4%9.4%

Demographics Similar to Immigrants and Immigrants from Afghanistan by Female Poverty Among 18-24 Year Olds

In terms of female poverty among 18-24 year olds, the demographic groups most similar to Immigrants are Immigrants from Iran (19.3%, a difference of 0.030%), Immigrants from Guyana (19.3%, a difference of 0.090%), Immigrants from Hungary (19.3%, a difference of 0.10%), Slovene (19.3%, a difference of 0.11%), and Cypriot (19.3%, a difference of 0.11%). Similarly, the demographic groups most similar to Immigrants from Afghanistan are Serbian (19.1%, a difference of 0.040%), Immigrants from Caribbean (19.1%, a difference of 0.080%), Immigrants from Ecuador (19.2%, a difference of 0.090%), Ecuadorian (19.1%, a difference of 0.11%), and Immigrants from Sierra Leone (19.2%, a difference of 0.12%).
DemographicsRating | RankFemale Poverty Among 18-24 Year Olds
Chileans
98.3
/100
|
#100
Exceptional
19.1%
Ecuadorians
98.1
/100
|
#101
Exceptional
19.1%
Immigrants | Caribbean
98.1
/100
|
#102
Exceptional
19.1%
Serbians
98.0
/100
|
#103
Exceptional
19.1%
Immigrants | Afghanistan
98.0
/100
|
#104
Exceptional
19.1%
Immigrants | Ecuador
97.8
/100
|
#105
Exceptional
19.2%
Immigrants | Sierra Leone
97.8
/100
|
#106
Exceptional
19.2%
Immigrants | Sri Lanka
97.5
/100
|
#107
Exceptional
19.2%
Immigrants | Uzbekistan
97.3
/100
|
#108
Exceptional
19.2%
Immigrants | Syria
97.2
/100
|
#109
Exceptional
19.2%
Laotians
97.1
/100
|
#110
Exceptional
19.2%
Immigrants | Serbia
97.1
/100
|
#111
Exceptional
19.2%
Immigrants | El Salvador
96.5
/100
|
#112
Exceptional
19.3%
Immigrants | Cameroon
96.3
/100
|
#113
Exceptional
19.3%
Slovenes
96.2
/100
|
#114
Exceptional
19.3%
Immigrants | Hungary
96.2
/100
|
#115
Exceptional
19.3%
Immigrants | Immigrants
95.9
/100
|
#116
Exceptional
19.3%
Immigrants | Iran
95.8
/100
|
#117
Exceptional
19.3%
Immigrants | Guyana
95.6
/100
|
#118
Exceptional
19.3%
Cypriots
95.5
/100
|
#119
Exceptional
19.3%
Immigrants | Northern Europe
95.4
/100
|
#120
Exceptional
19.4%