Immigrants from Western Africa vs Immigrants from Afghanistan Female Poverty Among 18-24 Year Olds
COMPARE
Immigrants from Western Africa
Immigrants from Afghanistan
Female Poverty Among 18-24 Year Olds
Female Poverty Among 18-24 Year Olds Comparison
Immigrants from Western Africa
Immigrants from Afghanistan
20.6%
FEMALE POVERTY AMONG 18-24 YEAR OLDS
10.2/ 100
METRIC RATING
216th/ 347
METRIC RANK
19.1%
FEMALE POVERTY AMONG 18-24 YEAR OLDS
98.0/ 100
METRIC RATING
104th/ 347
METRIC RANK
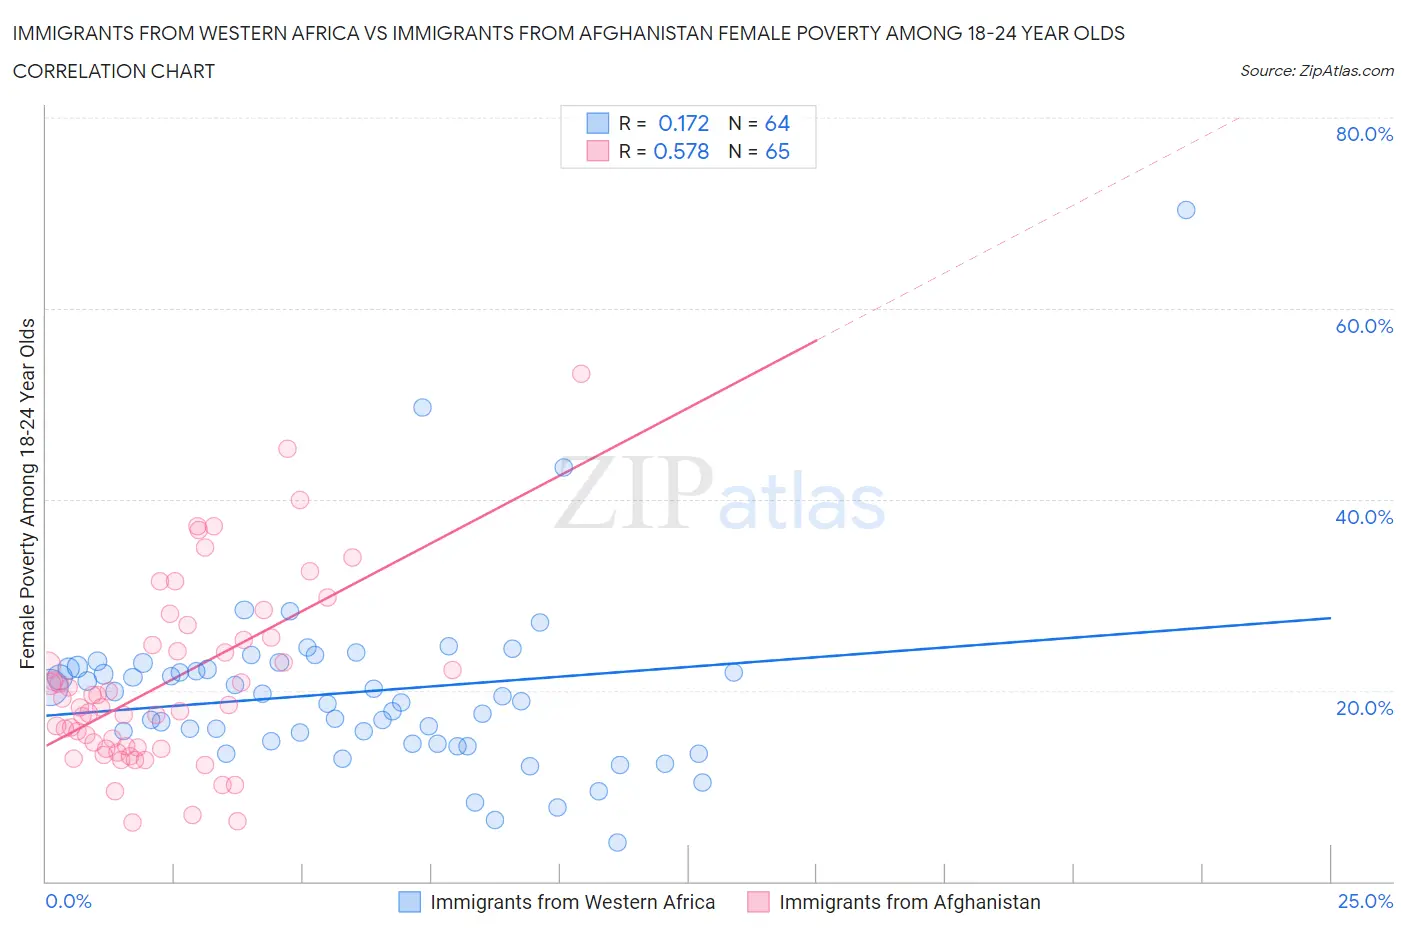
Immigrants from Western Africa vs Immigrants from Afghanistan Female Poverty Among 18-24 Year Olds Correlation Chart
The statistical analysis conducted on geographies consisting of 351,136,823 people shows a poor positive correlation between the proportion of Immigrants from Western Africa and poverty level among females between the ages 18 and 24 in the United States with a correlation coefficient (R) of 0.172 and weighted average of 20.6%. Similarly, the statistical analysis conducted on geographies consisting of 146,633,346 people shows a substantial positive correlation between the proportion of Immigrants from Afghanistan and poverty level among females between the ages 18 and 24 in the United States with a correlation coefficient (R) of 0.578 and weighted average of 19.1%, a difference of 7.8%.
Female Poverty Among 18-24 Year Olds Correlation Summary
| Measurement | Immigrants from Western Africa | Immigrants from Afghanistan |
| Minimum | 4.0% | 6.2% |
| Maximum | 70.3% | 53.1% |
| Range | 66.3% | 46.9% |
| Mean | 19.8% | 20.9% |
| Median | 19.1% | 18.4% |
| Interquartile 25% (IQ1) | 14.6% | 14.0% |
| Interquartile 75% (IQ3) | 22.4% | 25.4% |
| Interquartile Range (IQR) | 7.8% | 11.4% |
| Standard Deviation (Sample) | 9.7% | 9.5% |
| Standard Deviation (Population) | 9.6% | 9.4% |
Similar Demographics by Female Poverty Among 18-24 Year Olds
Demographics Similar to Immigrants from Western Africa by Female Poverty Among 18-24 Year Olds
In terms of female poverty among 18-24 year olds, the demographic groups most similar to Immigrants from Western Africa are Spanish (20.6%, a difference of 0.020%), Immigrants from South Africa (20.6%, a difference of 0.050%), Immigrants from Laos (20.6%, a difference of 0.070%), Immigrants from Nepal (20.7%, a difference of 0.080%), and Immigrants from Micronesia (20.7%, a difference of 0.090%).
| Demographics | Rating | Rank | Female Poverty Among 18-24 Year Olds |
| Arabs | 15.5 /100 | #209 | Poor 20.5% |
| Immigrants | Ghana | 14.3 /100 | #210 | Poor 20.5% |
| Immigrants | Western Europe | 13.5 /100 | #211 | Poor 20.6% |
| Liberians | 11.6 /100 | #212 | Poor 20.6% |
| Northern Europeans | 11.6 /100 | #213 | Poor 20.6% |
| Immigrants | South Africa | 10.7 /100 | #214 | Poor 20.6% |
| Spanish | 10.4 /100 | #215 | Poor 20.6% |
| Immigrants | Western Africa | 10.2 /100 | #216 | Poor 20.6% |
| Immigrants | Laos | 9.7 /100 | #217 | Tragic 20.6% |
| Immigrants | Nepal | 9.6 /100 | #218 | Tragic 20.7% |
| Immigrants | Micronesia | 9.6 /100 | #219 | Tragic 20.7% |
| British | 9.4 /100 | #220 | Tragic 20.7% |
| Barbadians | 9.0 /100 | #221 | Tragic 20.7% |
| Guatemalans | 8.1 /100 | #222 | Tragic 20.7% |
| French | 7.9 /100 | #223 | Tragic 20.7% |
Demographics Similar to Immigrants from Afghanistan by Female Poverty Among 18-24 Year Olds
In terms of female poverty among 18-24 year olds, the demographic groups most similar to Immigrants from Afghanistan are Serbian (19.1%, a difference of 0.040%), Immigrants from Caribbean (19.1%, a difference of 0.080%), Immigrants from Ecuador (19.2%, a difference of 0.090%), Ecuadorian (19.1%, a difference of 0.11%), and Immigrants from Sierra Leone (19.2%, a difference of 0.12%).
| Demographics | Rating | Rank | Female Poverty Among 18-24 Year Olds |
| Salvadorans | 98.4 /100 | #97 | Exceptional 19.1% |
| Immigrants | Jordan | 98.4 /100 | #98 | Exceptional 19.1% |
| Immigrants | Czechoslovakia | 98.3 /100 | #99 | Exceptional 19.1% |
| Chileans | 98.3 /100 | #100 | Exceptional 19.1% |
| Ecuadorians | 98.1 /100 | #101 | Exceptional 19.1% |
| Immigrants | Caribbean | 98.1 /100 | #102 | Exceptional 19.1% |
| Serbians | 98.0 /100 | #103 | Exceptional 19.1% |
| Immigrants | Afghanistan | 98.0 /100 | #104 | Exceptional 19.1% |
| Immigrants | Ecuador | 97.8 /100 | #105 | Exceptional 19.2% |
| Immigrants | Sierra Leone | 97.8 /100 | #106 | Exceptional 19.2% |
| Immigrants | Sri Lanka | 97.5 /100 | #107 | Exceptional 19.2% |
| Immigrants | Uzbekistan | 97.3 /100 | #108 | Exceptional 19.2% |
| Immigrants | Syria | 97.2 /100 | #109 | Exceptional 19.2% |
| Laotians | 97.1 /100 | #110 | Exceptional 19.2% |
| Immigrants | Serbia | 97.1 /100 | #111 | Exceptional 19.2% |