Immigrants from Latvia vs Yaqui Family Poverty
COMPARE
Immigrants from Latvia
Yaqui
Family Poverty
Family Poverty Comparison
Immigrants from Latvia
Yaqui
7.9%
FAMILY POVERTY
98.0/ 100
METRIC RATING
76th/ 347
METRIC RANK
11.3%
FAMILY POVERTY
0.0/ 100
METRIC RATING
284th/ 347
METRIC RANK
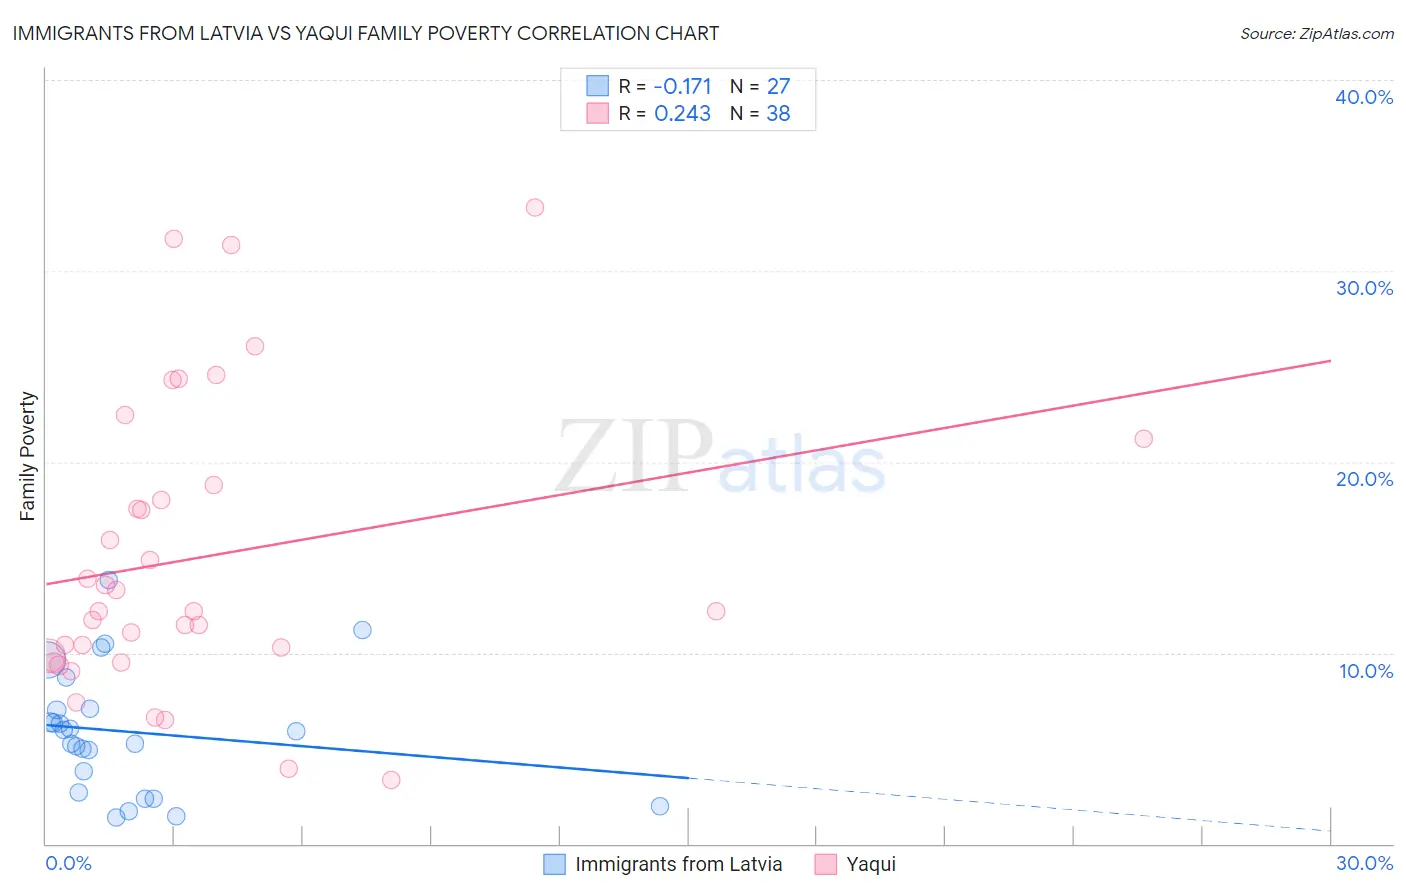
Immigrants from Latvia vs Yaqui Family Poverty Correlation Chart
The statistical analysis conducted on geographies consisting of 113,662,762 people shows a poor negative correlation between the proportion of Immigrants from Latvia and poverty level among families in the United States with a correlation coefficient (R) of -0.171 and weighted average of 7.9%. Similarly, the statistical analysis conducted on geographies consisting of 107,688,240 people shows a weak positive correlation between the proportion of Yaqui and poverty level among families in the United States with a correlation coefficient (R) of 0.243 and weighted average of 11.3%, a difference of 44.2%.
Family Poverty Correlation Summary
| Measurement | Immigrants from Latvia | Yaqui |
| Minimum | 1.4% | 3.3% |
| Maximum | 13.8% | 33.3% |
| Range | 12.5% | 30.0% |
| Mean | 5.9% | 15.0% |
| Median | 5.9% | 12.2% |
| Interquartile 25% (IQ1) | 2.7% | 9.8% |
| Interquartile 75% (IQ3) | 7.1% | 18.8% |
| Interquartile Range (IQR) | 4.4% | 8.9% |
| Standard Deviation (Sample) | 3.2% | 7.6% |
| Standard Deviation (Population) | 3.2% | 7.5% |
Similar Demographics by Family Poverty
Demographics Similar to Immigrants from Latvia by Family Poverty
In terms of family poverty, the demographic groups most similar to Immigrants from Latvia are Ukrainian (7.9%, a difference of 0.010%), Immigrants from North America (7.9%, a difference of 0.12%), Immigrants from Europe (7.9%, a difference of 0.20%), Immigrants from Croatia (7.8%, a difference of 0.23%), and English (7.9%, a difference of 0.26%).
| Demographics | Rating | Rank | Family Poverty |
| Immigrants | Belgium | 98.2 /100 | #69 | Exceptional 7.8% |
| Immigrants | Canada | 98.2 /100 | #70 | Exceptional 7.8% |
| Cambodians | 98.2 /100 | #71 | Exceptional 7.8% |
| Immigrants | Romania | 98.2 /100 | #72 | Exceptional 7.8% |
| Austrians | 98.2 /100 | #73 | Exceptional 7.8% |
| Immigrants | China | 98.1 /100 | #74 | Exceptional 7.8% |
| Immigrants | Croatia | 98.1 /100 | #75 | Exceptional 7.8% |
| Immigrants | Latvia | 98.0 /100 | #76 | Exceptional 7.9% |
| Ukrainians | 98.0 /100 | #77 | Exceptional 7.9% |
| Immigrants | North America | 97.9 /100 | #78 | Exceptional 7.9% |
| Immigrants | Europe | 97.8 /100 | #79 | Exceptional 7.9% |
| English | 97.8 /100 | #80 | Exceptional 7.9% |
| Irish | 97.8 /100 | #81 | Exceptional 7.9% |
| Immigrants | Poland | 97.8 /100 | #82 | Exceptional 7.9% |
| Slovaks | 97.7 /100 | #83 | Exceptional 7.9% |
Demographics Similar to Yaqui by Family Poverty
In terms of family poverty, the demographic groups most similar to Yaqui are Barbadian (11.3%, a difference of 0.080%), Indonesian (11.3%, a difference of 0.12%), Immigrants from Cuba (11.3%, a difference of 0.16%), Immigrants from West Indies (11.3%, a difference of 0.42%), and Belizean (11.3%, a difference of 0.69%).
| Demographics | Rating | Rank | Family Poverty |
| Chippewa | 0.1 /100 | #277 | Tragic 11.2% |
| Guyanese | 0.1 /100 | #278 | Tragic 11.2% |
| Blackfeet | 0.0 /100 | #279 | Tragic 11.3% |
| Belizeans | 0.0 /100 | #280 | Tragic 11.3% |
| Immigrants | West Indies | 0.0 /100 | #281 | Tragic 11.3% |
| Immigrants | Cuba | 0.0 /100 | #282 | Tragic 11.3% |
| Indonesians | 0.0 /100 | #283 | Tragic 11.3% |
| Yaqui | 0.0 /100 | #284 | Tragic 11.3% |
| Barbadians | 0.0 /100 | #285 | Tragic 11.3% |
| Senegalese | 0.0 /100 | #286 | Tragic 11.5% |
| Vietnamese | 0.0 /100 | #287 | Tragic 11.5% |
| Immigrants | Belize | 0.0 /100 | #288 | Tragic 11.5% |
| Immigrants | Barbados | 0.0 /100 | #289 | Tragic 11.5% |
| West Indians | 0.0 /100 | #290 | Tragic 11.5% |
| Haitians | 0.0 /100 | #291 | Tragic 11.5% |