Immigrants from Latvia vs Immigrants from Romania Child Poverty Among Girls Under 16
COMPARE
Immigrants from Latvia
Immigrants from Romania
Child Poverty Among Girls Under 16
Child Poverty Among Girls Under 16 Comparison
Immigrants from Latvia
Immigrants from Romania
14.9%
CHILD POVERTY AMONG GIRLS UNDER 16
96.1/ 100
METRIC RATING
97th/ 347
METRIC RANK
14.3%
CHILD POVERTY AMONG GIRLS UNDER 16
98.9/ 100
METRIC RATING
55th/ 347
METRIC RANK
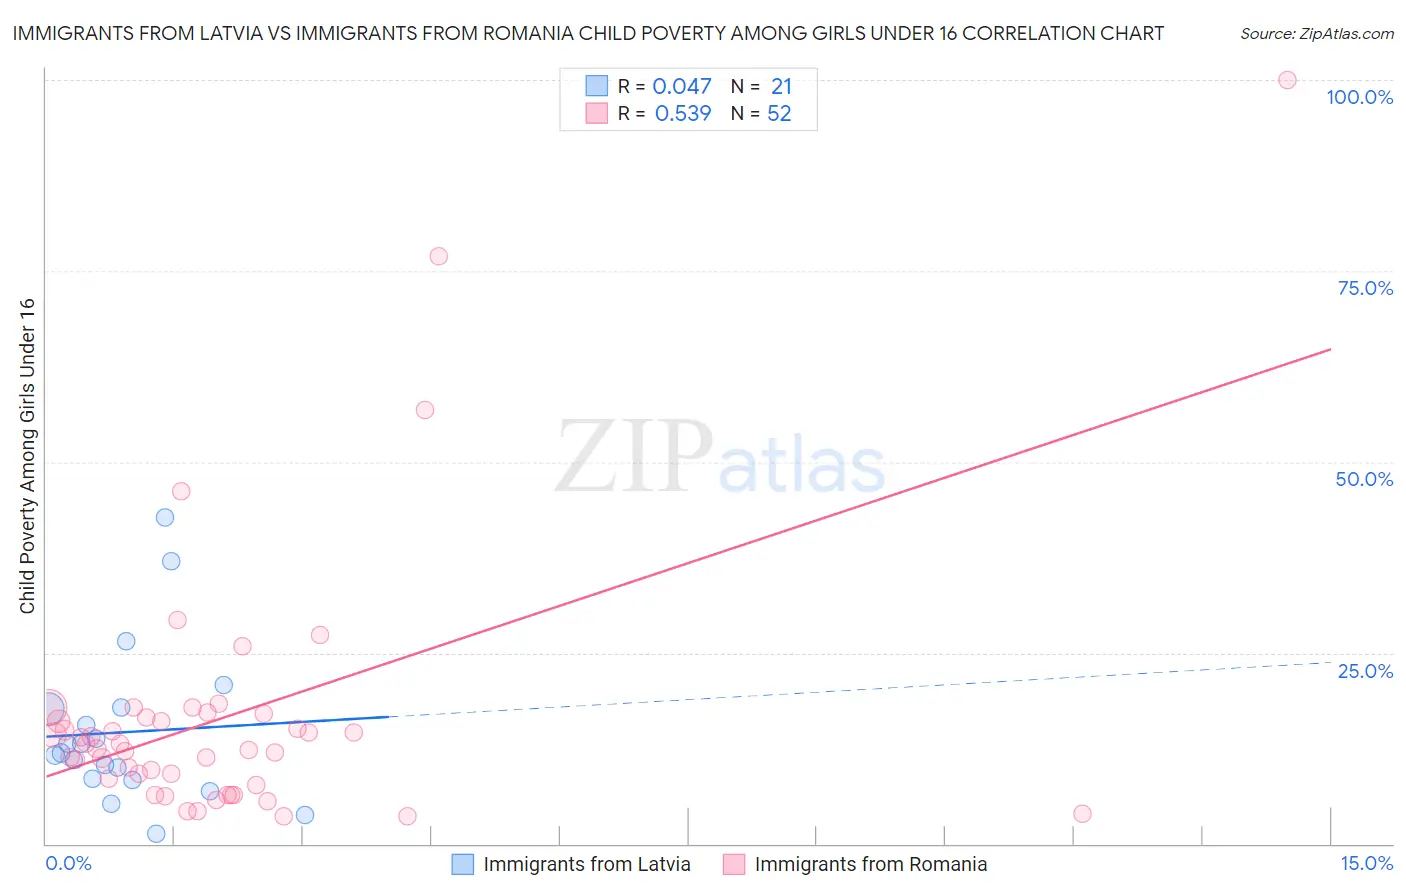
Immigrants from Latvia vs Immigrants from Romania Child Poverty Among Girls Under 16 Correlation Chart
The statistical analysis conducted on geographies consisting of 112,633,349 people shows no correlation between the proportion of Immigrants from Latvia and poverty level among girls under the age of 16 in the United States with a correlation coefficient (R) of 0.047 and weighted average of 14.9%. Similarly, the statistical analysis conducted on geographies consisting of 253,629,326 people shows a substantial positive correlation between the proportion of Immigrants from Romania and poverty level among girls under the age of 16 in the United States with a correlation coefficient (R) of 0.539 and weighted average of 14.3%, a difference of 4.2%.
Child Poverty Among Girls Under 16 Correlation Summary
| Measurement | Immigrants from Latvia | Immigrants from Romania |
| Minimum | 1.3% | 3.6% |
| Maximum | 42.7% | 100.0% |
| Range | 41.4% | 96.4% |
| Mean | 14.6% | 16.7% |
| Median | 11.9% | 12.8% |
| Interquartile 25% (IQ1) | 8.5% | 8.1% |
| Interquartile 75% (IQ3) | 17.7% | 16.8% |
| Interquartile Range (IQR) | 9.3% | 8.6% |
| Standard Deviation (Sample) | 10.2% | 17.5% |
| Standard Deviation (Population) | 9.9% | 17.3% |
Similar Demographics by Child Poverty Among Girls Under 16
Demographics Similar to Immigrants from Latvia by Child Poverty Among Girls Under 16
In terms of child poverty among girls under 16, the demographic groups most similar to Immigrants from Latvia are Immigrants from France (14.9%, a difference of 0.090%), German (14.9%, a difference of 0.13%), Immigrants from Switzerland (14.9%, a difference of 0.16%), Basque (15.0%, a difference of 0.19%), and Immigrants from Egypt (15.0%, a difference of 0.34%).
| Demographics | Rating | Rank | Child Poverty Among Girls Under 16 |
| Northern Europeans | 97.0 /100 | #90 | Exceptional 14.8% |
| Immigrants | Belarus | 97.0 /100 | #91 | Exceptional 14.8% |
| Austrians | 96.7 /100 | #92 | Exceptional 14.9% |
| Immigrants | North America | 96.6 /100 | #93 | Exceptional 14.9% |
| Immigrants | Switzerland | 96.3 /100 | #94 | Exceptional 14.9% |
| Germans | 96.3 /100 | #95 | Exceptional 14.9% |
| Immigrants | France | 96.2 /100 | #96 | Exceptional 14.9% |
| Immigrants | Latvia | 96.1 /100 | #97 | Exceptional 14.9% |
| Basques | 95.9 /100 | #98 | Exceptional 15.0% |
| Immigrants | Egypt | 95.7 /100 | #99 | Exceptional 15.0% |
| Paraguayans | 95.7 /100 | #100 | Exceptional 15.0% |
| Immigrants | South Africa | 95.6 /100 | #101 | Exceptional 15.0% |
| Immigrants | Malaysia | 95.6 /100 | #102 | Exceptional 15.0% |
| British | 95.6 /100 | #103 | Exceptional 15.0% |
| Romanians | 95.3 /100 | #104 | Exceptional 15.0% |
Demographics Similar to Immigrants from Romania by Child Poverty Among Girls Under 16
In terms of child poverty among girls under 16, the demographic groups most similar to Immigrants from Romania are Estonian (14.3%, a difference of 0.040%), Immigrants from Indonesia (14.4%, a difference of 0.080%), Immigrants from Serbia (14.4%, a difference of 0.12%), Immigrants from Bulgaria (14.4%, a difference of 0.21%), and Zimbabwean (14.4%, a difference of 0.27%).
| Demographics | Rating | Rank | Child Poverty Among Girls Under 16 |
| Czechs | 99.3 /100 | #48 | Exceptional 14.2% |
| Greeks | 99.2 /100 | #49 | Exceptional 14.2% |
| Immigrants | Israel | 99.2 /100 | #50 | Exceptional 14.2% |
| Immigrants | Pakistan | 99.1 /100 | #51 | Exceptional 14.2% |
| Italians | 99.1 /100 | #52 | Exceptional 14.3% |
| Luxembourgers | 99.0 /100 | #53 | Exceptional 14.3% |
| Estonians | 98.9 /100 | #54 | Exceptional 14.3% |
| Immigrants | Romania | 98.9 /100 | #55 | Exceptional 14.3% |
| Immigrants | Indonesia | 98.9 /100 | #56 | Exceptional 14.4% |
| Immigrants | Serbia | 98.9 /100 | #57 | Exceptional 14.4% |
| Immigrants | Bulgaria | 98.8 /100 | #58 | Exceptional 14.4% |
| Zimbabweans | 98.8 /100 | #59 | Exceptional 14.4% |
| Poles | 98.7 /100 | #60 | Exceptional 14.4% |
| Cambodians | 98.7 /100 | #61 | Exceptional 14.4% |
| Scandinavians | 98.7 /100 | #62 | Exceptional 14.4% |