Immigrants from Latvia vs Cuban Child Poverty Among Girls Under 16
COMPARE
Immigrants from Latvia
Cuban
Child Poverty Among Girls Under 16
Child Poverty Among Girls Under 16 Comparison
Immigrants from Latvia
Cubans
14.9%
CHILD POVERTY AMONG GIRLS UNDER 16
96.1/ 100
METRIC RATING
97th/ 347
METRIC RANK
18.0%
CHILD POVERTY AMONG GIRLS UNDER 16
4.1/ 100
METRIC RATING
220th/ 347
METRIC RANK
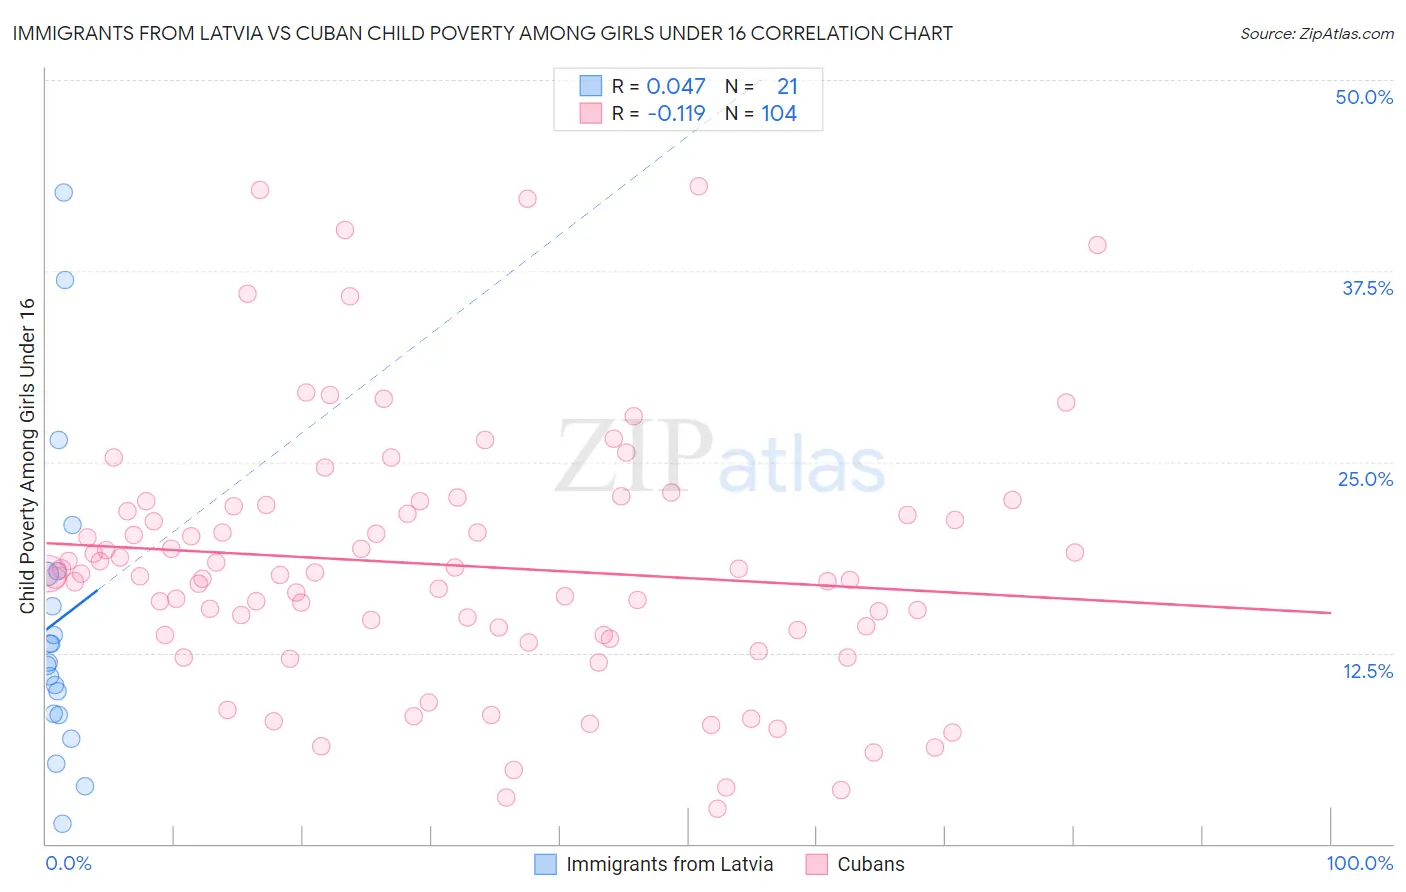
Immigrants from Latvia vs Cuban Child Poverty Among Girls Under 16 Correlation Chart
The statistical analysis conducted on geographies consisting of 112,633,349 people shows no correlation between the proportion of Immigrants from Latvia and poverty level among girls under the age of 16 in the United States with a correlation coefficient (R) of 0.047 and weighted average of 14.9%. Similarly, the statistical analysis conducted on geographies consisting of 440,192,797 people shows a poor negative correlation between the proportion of Cubans and poverty level among girls under the age of 16 in the United States with a correlation coefficient (R) of -0.119 and weighted average of 18.0%, a difference of 20.1%.
Child Poverty Among Girls Under 16 Correlation Summary
| Measurement | Immigrants from Latvia | Cuban |
| Minimum | 1.3% | 2.3% |
| Maximum | 42.7% | 43.1% |
| Range | 41.4% | 40.8% |
| Mean | 14.6% | 18.2% |
| Median | 11.9% | 17.6% |
| Interquartile 25% (IQ1) | 8.5% | 13.7% |
| Interquartile 75% (IQ3) | 17.7% | 21.9% |
| Interquartile Range (IQR) | 9.3% | 8.3% |
| Standard Deviation (Sample) | 10.2% | 8.5% |
| Standard Deviation (Population) | 9.9% | 8.5% |
Similar Demographics by Child Poverty Among Girls Under 16
Demographics Similar to Immigrants from Latvia by Child Poverty Among Girls Under 16
In terms of child poverty among girls under 16, the demographic groups most similar to Immigrants from Latvia are Immigrants from France (14.9%, a difference of 0.090%), German (14.9%, a difference of 0.13%), Immigrants from Switzerland (14.9%, a difference of 0.16%), Basque (15.0%, a difference of 0.19%), and Immigrants from Egypt (15.0%, a difference of 0.34%).
| Demographics | Rating | Rank | Child Poverty Among Girls Under 16 |
| Northern Europeans | 97.0 /100 | #90 | Exceptional 14.8% |
| Immigrants | Belarus | 97.0 /100 | #91 | Exceptional 14.8% |
| Austrians | 96.7 /100 | #92 | Exceptional 14.9% |
| Immigrants | North America | 96.6 /100 | #93 | Exceptional 14.9% |
| Immigrants | Switzerland | 96.3 /100 | #94 | Exceptional 14.9% |
| Germans | 96.3 /100 | #95 | Exceptional 14.9% |
| Immigrants | France | 96.2 /100 | #96 | Exceptional 14.9% |
| Immigrants | Latvia | 96.1 /100 | #97 | Exceptional 14.9% |
| Basques | 95.9 /100 | #98 | Exceptional 15.0% |
| Immigrants | Egypt | 95.7 /100 | #99 | Exceptional 15.0% |
| Paraguayans | 95.7 /100 | #100 | Exceptional 15.0% |
| Immigrants | South Africa | 95.6 /100 | #101 | Exceptional 15.0% |
| Immigrants | Malaysia | 95.6 /100 | #102 | Exceptional 15.0% |
| British | 95.6 /100 | #103 | Exceptional 15.0% |
| Romanians | 95.3 /100 | #104 | Exceptional 15.0% |
Demographics Similar to Cubans by Child Poverty Among Girls Under 16
In terms of child poverty among girls under 16, the demographic groups most similar to Cubans are Immigrants from Panama (17.9%, a difference of 0.38%), Immigrants from Micronesia (18.0%, a difference of 0.43%), Alaska Native (17.8%, a difference of 0.62%), Japanese (17.8%, a difference of 0.72%), and Moroccan (17.8%, a difference of 0.80%).
| Demographics | Rating | Rank | Child Poverty Among Girls Under 16 |
| Pennsylvania Germans | 5.7 /100 | #213 | Tragic 17.8% |
| Malaysians | 5.7 /100 | #214 | Tragic 17.8% |
| German Russians | 5.7 /100 | #215 | Tragic 17.8% |
| Moroccans | 5.5 /100 | #216 | Tragic 17.8% |
| Japanese | 5.3 /100 | #217 | Tragic 17.8% |
| Alaska Natives | 5.2 /100 | #218 | Tragic 17.8% |
| Immigrants | Panama | 4.7 /100 | #219 | Tragic 17.9% |
| Cubans | 4.1 /100 | #220 | Tragic 18.0% |
| Immigrants | Micronesia | 3.5 /100 | #221 | Tragic 18.0% |
| Immigrants | Cambodia | 2.9 /100 | #222 | Tragic 18.1% |
| Immigrants | Armenia | 2.9 /100 | #223 | Tragic 18.1% |
| Bermudans | 2.8 /100 | #224 | Tragic 18.1% |
| Immigrants | Africa | 2.7 /100 | #225 | Tragic 18.2% |
| Nicaraguans | 2.4 /100 | #226 | Tragic 18.2% |
| Immigrants | Nonimmigrants | 2.0 /100 | #227 | Tragic 18.3% |