Immigrants from Kuwait vs Liberian Child Poverty Among Girls Under 16
COMPARE
Immigrants from Kuwait
Liberian
Child Poverty Among Girls Under 16
Child Poverty Among Girls Under 16 Comparison
Immigrants from Kuwait
Liberians
15.8%
CHILD POVERTY AMONG GIRLS UNDER 16
79.4/ 100
METRIC RATING
152nd/ 347
METRIC RANK
19.9%
CHILD POVERTY AMONG GIRLS UNDER 16
0.1/ 100
METRIC RATING
269th/ 347
METRIC RANK
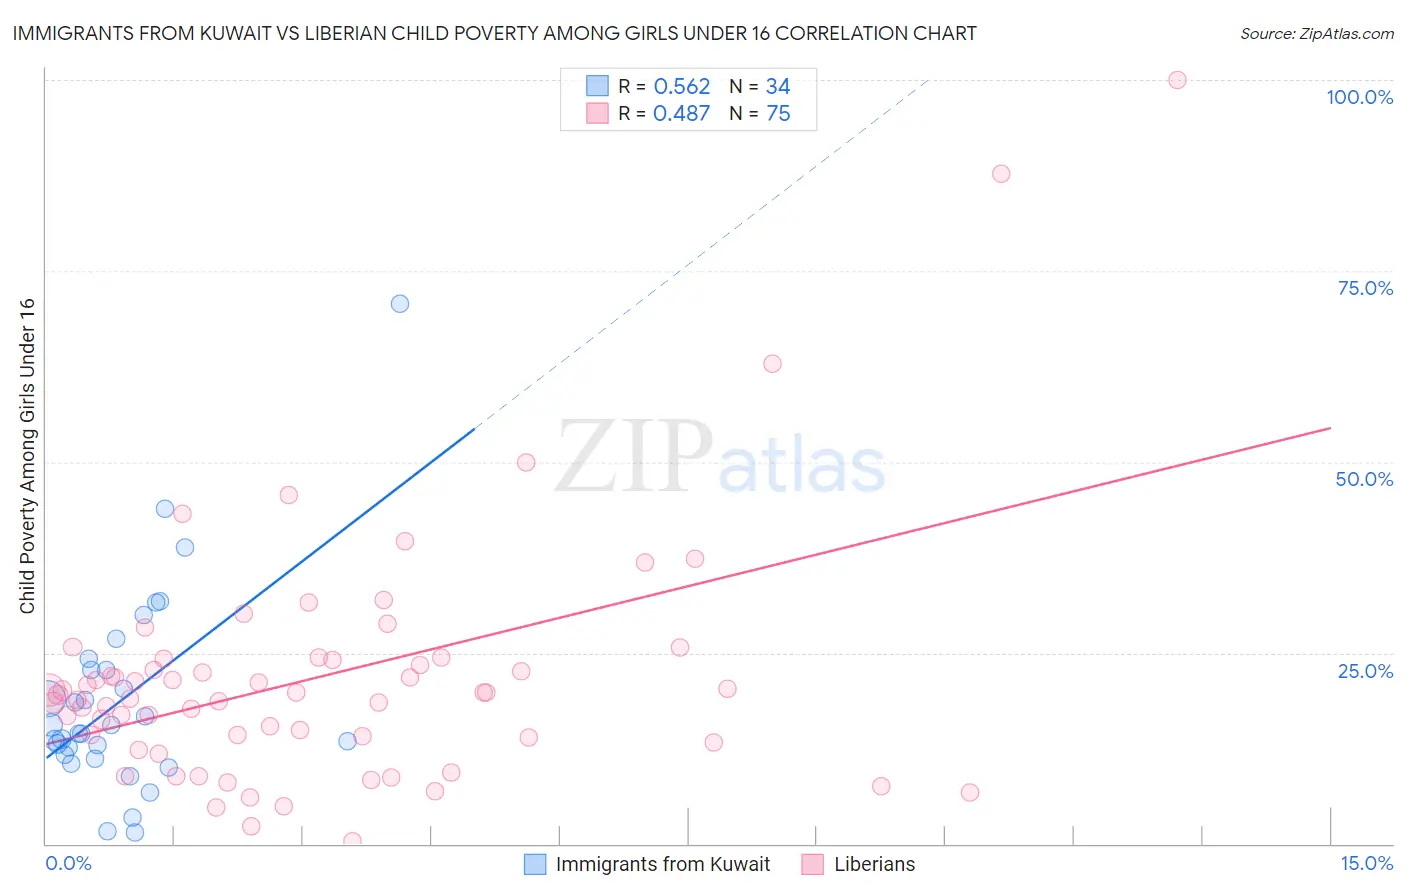
Immigrants from Kuwait vs Liberian Child Poverty Among Girls Under 16 Correlation Chart
The statistical analysis conducted on geographies consisting of 136,192,954 people shows a substantial positive correlation between the proportion of Immigrants from Kuwait and poverty level among girls under the age of 16 in the United States with a correlation coefficient (R) of 0.562 and weighted average of 15.8%. Similarly, the statistical analysis conducted on geographies consisting of 117,670,688 people shows a moderate positive correlation between the proportion of Liberians and poverty level among girls under the age of 16 in the United States with a correlation coefficient (R) of 0.487 and weighted average of 19.9%, a difference of 25.6%.
Child Poverty Among Girls Under 16 Correlation Summary
| Measurement | Immigrants from Kuwait | Liberian |
| Minimum | 1.4% | 0.32% |
| Maximum | 70.8% | 100.0% |
| Range | 69.4% | 99.7% |
| Mean | 18.9% | 21.9% |
| Median | 15.0% | 19.7% |
| Interquartile 25% (IQ1) | 11.6% | 14.0% |
| Interquartile 75% (IQ3) | 22.8% | 24.3% |
| Interquartile Range (IQR) | 11.2% | 10.3% |
| Standard Deviation (Sample) | 13.4% | 16.2% |
| Standard Deviation (Population) | 13.2% | 16.1% |
Similar Demographics by Child Poverty Among Girls Under 16
Demographics Similar to Immigrants from Kuwait by Child Poverty Among Girls Under 16
In terms of child poverty among girls under 16, the demographic groups most similar to Immigrants from Kuwait are Venezuelan (15.8%, a difference of 0.14%), Immigrants from Nepal (15.9%, a difference of 0.15%), Immigrants from Albania (15.8%, a difference of 0.24%), Immigrants from Hungary (15.8%, a difference of 0.28%), and Immigrants from Chile (15.9%, a difference of 0.46%).
| Demographics | Rating | Rank | Child Poverty Among Girls Under 16 |
| Welsh | 85.4 /100 | #145 | Excellent 15.6% |
| Samoans | 84.2 /100 | #146 | Excellent 15.7% |
| Slavs | 83.1 /100 | #147 | Excellent 15.7% |
| Icelanders | 82.4 /100 | #148 | Excellent 15.7% |
| Immigrants | Hungary | 80.9 /100 | #149 | Excellent 15.8% |
| Immigrants | Albania | 80.7 /100 | #150 | Excellent 15.8% |
| Venezuelans | 80.1 /100 | #151 | Excellent 15.8% |
| Immigrants | Kuwait | 79.4 /100 | #152 | Good 15.8% |
| Immigrants | Nepal | 78.5 /100 | #153 | Good 15.9% |
| Immigrants | Chile | 76.7 /100 | #154 | Good 15.9% |
| Syrians | 76.7 /100 | #155 | Good 15.9% |
| Immigrants | Fiji | 76.1 /100 | #156 | Good 15.9% |
| Colombians | 76.1 /100 | #157 | Good 15.9% |
| Guamanians/Chamorros | 75.3 /100 | #158 | Good 15.9% |
| Slovaks | 75.2 /100 | #159 | Good 15.9% |
Demographics Similar to Liberians by Child Poverty Among Girls Under 16
In terms of child poverty among girls under 16, the demographic groups most similar to Liberians are Spanish American Indian (19.9%, a difference of 0.10%), Immigrants from Bangladesh (19.9%, a difference of 0.14%), Cherokee (19.9%, a difference of 0.18%), Immigrants from Barbados (19.9%, a difference of 0.29%), and Spanish American (19.8%, a difference of 0.35%).
| Demographics | Rating | Rank | Child Poverty Among Girls Under 16 |
| Chickasaw | 0.1 /100 | #262 | Tragic 19.6% |
| Immigrants | Burma/Myanmar | 0.1 /100 | #263 | Tragic 19.7% |
| Jamaicans | 0.1 /100 | #264 | Tragic 19.7% |
| Immigrants | Jamaica | 0.1 /100 | #265 | Tragic 19.8% |
| Spanish Americans | 0.1 /100 | #266 | Tragic 19.8% |
| Immigrants | Bangladesh | 0.1 /100 | #267 | Tragic 19.9% |
| Spanish American Indians | 0.1 /100 | #268 | Tragic 19.9% |
| Liberians | 0.1 /100 | #269 | Tragic 19.9% |
| Cherokee | 0.1 /100 | #270 | Tragic 19.9% |
| Immigrants | Barbados | 0.1 /100 | #271 | Tragic 19.9% |
| Immigrants | El Salvador | 0.1 /100 | #272 | Tragic 20.0% |
| Bangladeshis | 0.1 /100 | #273 | Tragic 20.0% |
| Immigrants | St. Vincent and the Grenadines | 0.0 /100 | #274 | Tragic 20.1% |
| Sub-Saharan Africans | 0.0 /100 | #275 | Tragic 20.1% |
| Comanche | 0.0 /100 | #276 | Tragic 20.2% |