Immigrants from Korea vs Immigrants from Dominica Male Poverty
COMPARE
Immigrants from Korea
Immigrants from Dominica
Male Poverty
Male Poverty Comparison
Immigrants from Korea
Immigrants from Dominica
9.7%
MALE POVERTY
99.6/ 100
METRIC RATING
28th/ 347
METRIC RANK
14.7%
MALE POVERTY
0.0/ 100
METRIC RATING
317th/ 347
METRIC RANK
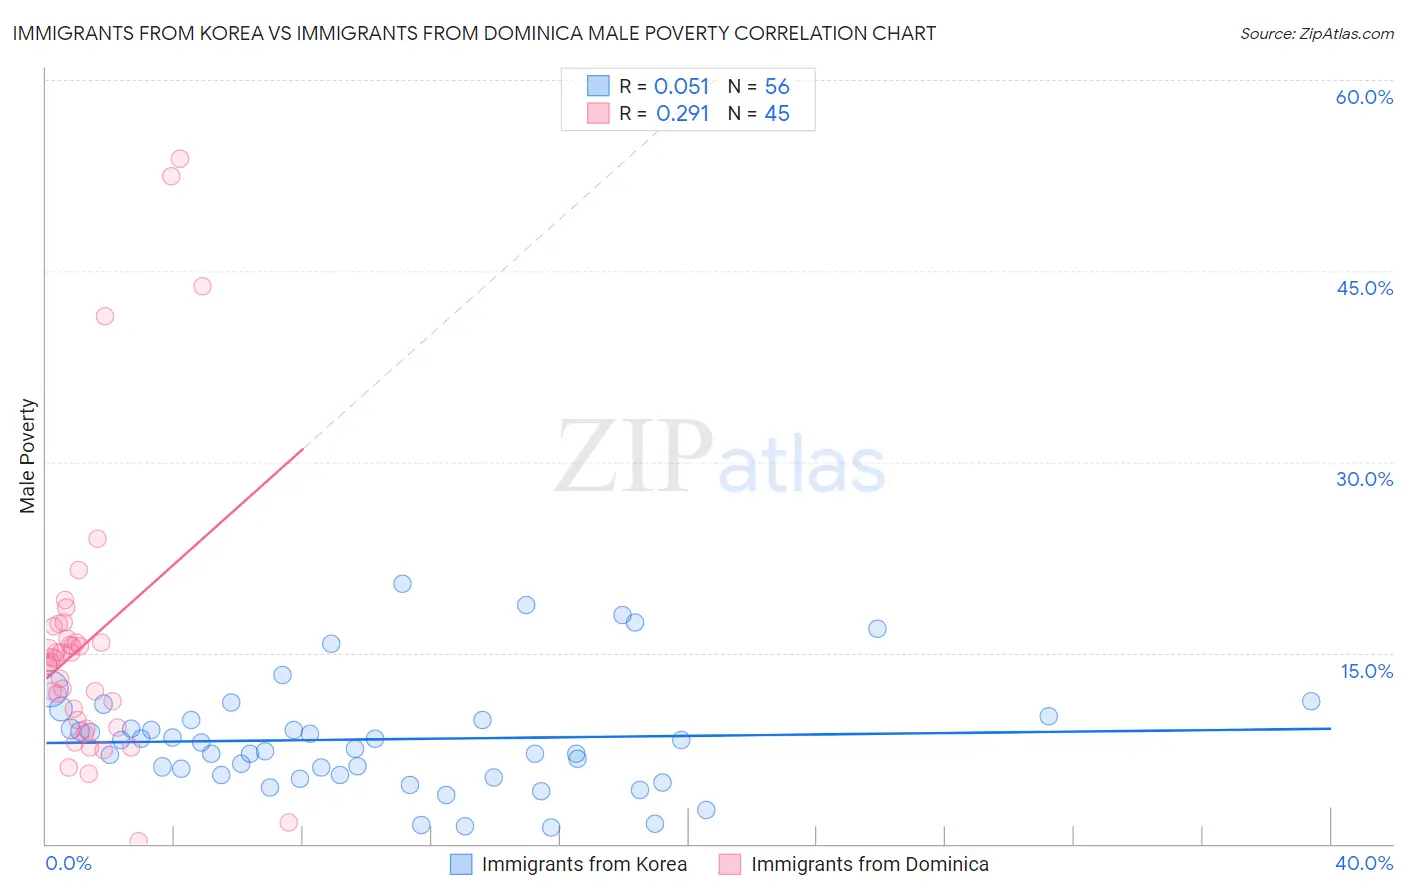
Immigrants from Korea vs Immigrants from Dominica Male Poverty Correlation Chart
The statistical analysis conducted on geographies consisting of 415,786,791 people shows a slight positive correlation between the proportion of Immigrants from Korea and poverty level among males in the United States with a correlation coefficient (R) of 0.051 and weighted average of 9.7%. Similarly, the statistical analysis conducted on geographies consisting of 83,775,975 people shows a weak positive correlation between the proportion of Immigrants from Dominica and poverty level among males in the United States with a correlation coefficient (R) of 0.291 and weighted average of 14.7%, a difference of 51.5%.
Male Poverty Correlation Summary
| Measurement | Immigrants from Korea | Immigrants from Dominica |
| Minimum | 1.2% | 0.21% |
| Maximum | 20.5% | 53.8% |
| Range | 19.2% | 53.6% |
| Mean | 8.2% | 15.9% |
| Median | 7.7% | 14.5% |
| Interquartile 25% (IQ1) | 5.4% | 9.4% |
| Interquartile 75% (IQ3) | 9.7% | 16.6% |
| Interquartile Range (IQR) | 4.3% | 7.2% |
| Standard Deviation (Sample) | 4.3% | 11.3% |
| Standard Deviation (Population) | 4.3% | 11.1% |
Similar Demographics by Male Poverty
Demographics Similar to Immigrants from Korea by Male Poverty
In terms of male poverty, the demographic groups most similar to Immigrants from Korea are Greek (9.7%, a difference of 0.040%), Danish (9.7%, a difference of 0.080%), Polish (9.7%, a difference of 0.12%), Tongan (9.7%, a difference of 0.14%), and Burmese (9.7%, a difference of 0.21%).
| Demographics | Rating | Rank | Male Poverty |
| Immigrants | Scotland | 99.7 /100 | #21 | Exceptional 9.6% |
| Croatians | 99.7 /100 | #22 | Exceptional 9.6% |
| Italians | 99.7 /100 | #23 | Exceptional 9.6% |
| Swedes | 99.7 /100 | #24 | Exceptional 9.6% |
| Eastern Europeans | 99.6 /100 | #25 | Exceptional 9.6% |
| Burmese | 99.6 /100 | #26 | Exceptional 9.7% |
| Danes | 99.6 /100 | #27 | Exceptional 9.7% |
| Immigrants | Korea | 99.6 /100 | #28 | Exceptional 9.7% |
| Greeks | 99.6 /100 | #29 | Exceptional 9.7% |
| Poles | 99.5 /100 | #30 | Exceptional 9.7% |
| Tongans | 99.5 /100 | #31 | Exceptional 9.7% |
| Macedonians | 99.5 /100 | #32 | Exceptional 9.7% |
| Immigrants | Northern Europe | 99.5 /100 | #33 | Exceptional 9.7% |
| Immigrants | Poland | 99.5 /100 | #34 | Exceptional 9.8% |
| Iranians | 99.4 /100 | #35 | Exceptional 9.8% |
Demographics Similar to Immigrants from Dominica by Male Poverty
In terms of male poverty, the demographic groups most similar to Immigrants from Dominica are Immigrants from Grenada (14.7%, a difference of 0.060%), U.S. Virgin Islander (14.7%, a difference of 0.090%), Immigrants from Congo (14.7%, a difference of 0.18%), British West Indian (14.6%, a difference of 0.68%), and Chippewa (14.6%, a difference of 0.70%).
| Demographics | Rating | Rank | Male Poverty |
| Seminole | 0.0 /100 | #310 | Tragic 14.3% |
| Hondurans | 0.0 /100 | #311 | Tragic 14.3% |
| Choctaw | 0.0 /100 | #312 | Tragic 14.4% |
| Immigrants | Somalia | 0.0 /100 | #313 | Tragic 14.6% |
| Immigrants | Honduras | 0.0 /100 | #314 | Tragic 14.6% |
| Chippewa | 0.0 /100 | #315 | Tragic 14.6% |
| British West Indians | 0.0 /100 | #316 | Tragic 14.6% |
| Immigrants | Dominica | 0.0 /100 | #317 | Tragic 14.7% |
| Immigrants | Grenada | 0.0 /100 | #318 | Tragic 14.7% |
| U.S. Virgin Islanders | 0.0 /100 | #319 | Tragic 14.7% |
| Immigrants | Congo | 0.0 /100 | #320 | Tragic 14.7% |
| Arapaho | 0.0 /100 | #321 | Tragic 15.1% |
| Kiowa | 0.0 /100 | #322 | Tragic 15.2% |
| Colville | 0.0 /100 | #323 | Tragic 15.2% |
| Menominee | 0.0 /100 | #324 | Tragic 15.3% |