Immigrants from Kenya vs Inupiat 6th Grade
COMPARE
Immigrants from Kenya
Inupiat
6th Grade
6th Grade Comparison
Immigrants from Kenya
Inupiat
97.0%
6TH GRADE
45.3/ 100
METRIC RATING
179th/ 347
METRIC RANK
98.1%
6TH GRADE
100.0/ 100
METRIC RATING
15th/ 347
METRIC RANK
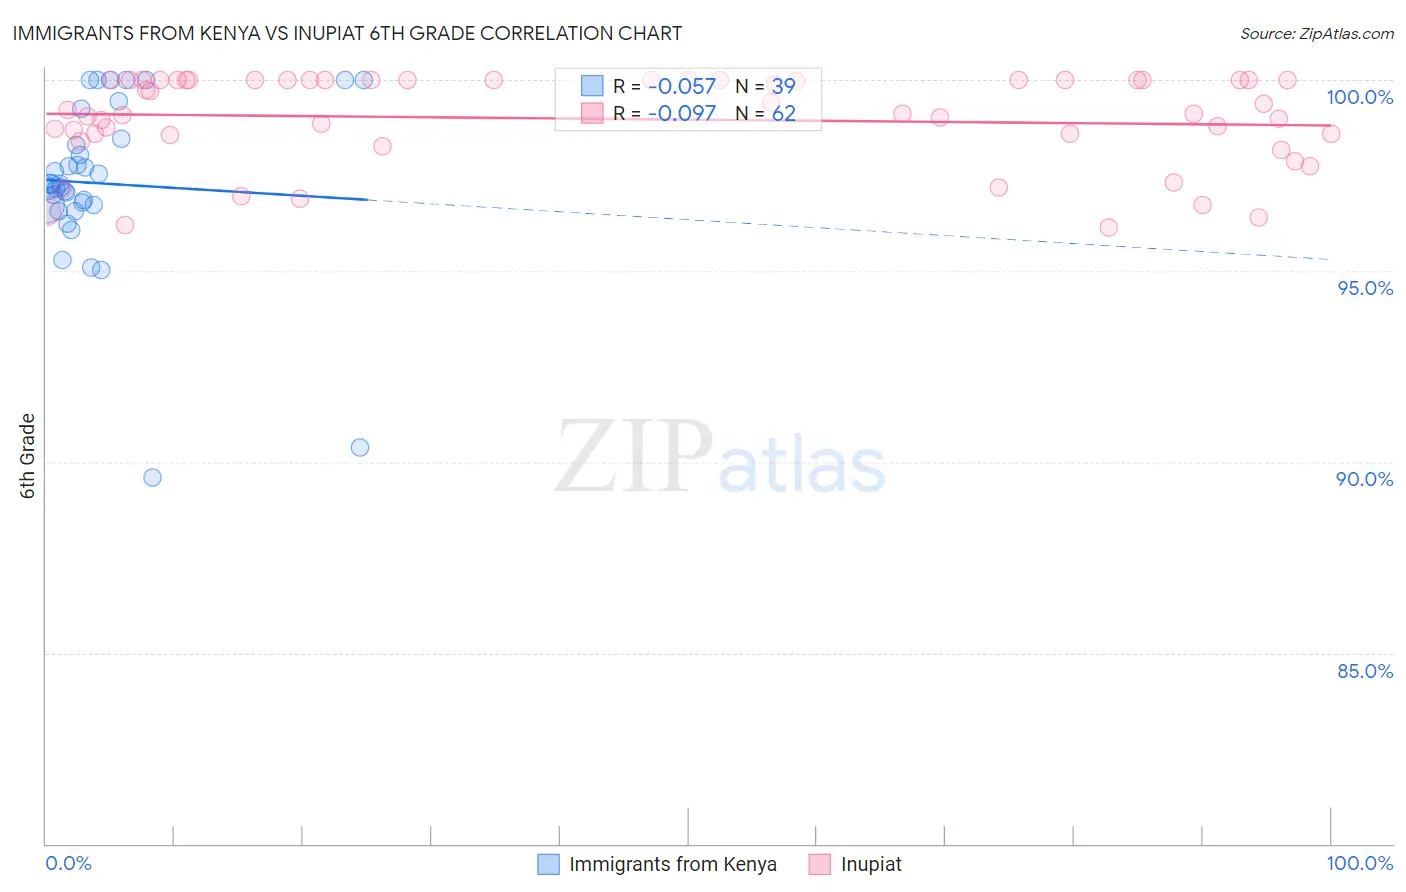
Immigrants from Kenya vs Inupiat 6th Grade Correlation Chart
The statistical analysis conducted on geographies consisting of 218,076,690 people shows a slight negative correlation between the proportion of Immigrants from Kenya and percentage of population with at least 6th grade education in the United States with a correlation coefficient (R) of -0.057 and weighted average of 97.0%. Similarly, the statistical analysis conducted on geographies consisting of 96,348,974 people shows a slight negative correlation between the proportion of Inupiat and percentage of population with at least 6th grade education in the United States with a correlation coefficient (R) of -0.097 and weighted average of 98.1%, a difference of 1.1%.
6th Grade Correlation Summary
| Measurement | Immigrants from Kenya | Inupiat |
| Minimum | 89.6% | 96.2% |
| Maximum | 100.0% | 100.0% |
| Range | 10.4% | 3.8% |
| Mean | 97.3% | 99.0% |
| Median | 97.3% | 99.2% |
| Interquartile 25% (IQ1) | 96.7% | 98.6% |
| Interquartile 75% (IQ3) | 98.5% | 100.0% |
| Interquartile Range (IQR) | 1.7% | 1.4% |
| Standard Deviation (Sample) | 2.2% | 1.2% |
| Standard Deviation (Population) | 2.2% | 1.2% |
Similar Demographics by 6th Grade
Demographics Similar to Immigrants from Kenya by 6th Grade
In terms of 6th grade, the demographic groups most similar to Immigrants from Kenya are Pakistani (97.0%, a difference of 0.0%), Immigrants from Kazakhstan (97.0%, a difference of 0.010%), Immigrants from Micronesia (97.0%, a difference of 0.010%), Mongolian (97.0%, a difference of 0.010%), and Arab (97.0%, a difference of 0.020%).
| Demographics | Rating | Rank | 6th Grade |
| Egyptians | 50.9 /100 | #172 | Average 97.1% |
| Arabs | 50.1 /100 | #173 | Average 97.0% |
| Venezuelans | 50.0 /100 | #174 | Average 97.0% |
| Immigrants | Kazakhstan | 47.3 /100 | #175 | Average 97.0% |
| Immigrants | Micronesia | 47.1 /100 | #176 | Average 97.0% |
| Mongolians | 46.7 /100 | #177 | Average 97.0% |
| Pakistanis | 46.0 /100 | #178 | Average 97.0% |
| Immigrants | Kenya | 45.3 /100 | #179 | Average 97.0% |
| Immigrants | Spain | 39.9 /100 | #180 | Fair 97.0% |
| Comanche | 37.9 /100 | #181 | Fair 97.0% |
| Immigrants | Ukraine | 35.6 /100 | #182 | Fair 97.0% |
| Immigrants | Venezuela | 34.5 /100 | #183 | Fair 97.0% |
| Spanish Americans | 33.5 /100 | #184 | Fair 97.0% |
| Argentineans | 33.0 /100 | #185 | Fair 97.0% |
| Immigrants | Egypt | 31.4 /100 | #186 | Fair 97.0% |
Demographics Similar to Inupiat by 6th Grade
In terms of 6th grade, the demographic groups most similar to Inupiat are Carpatho Rusyn (98.1%, a difference of 0.010%), Scottish (98.1%, a difference of 0.010%), Tlingit-Haida (98.1%, a difference of 0.020%), Polish (98.1%, a difference of 0.020%), and Pennsylvania German (98.1%, a difference of 0.020%).
| Demographics | Rating | Rank | 6th Grade |
| Slovaks | 100.0 /100 | #8 | Exceptional 98.2% |
| Slovenes | 100.0 /100 | #9 | Exceptional 98.2% |
| Swedes | 100.0 /100 | #10 | Exceptional 98.2% |
| English | 100.0 /100 | #11 | Exceptional 98.1% |
| Alaskan Athabascans | 100.0 /100 | #12 | Exceptional 98.1% |
| Tlingit-Haida | 100.0 /100 | #13 | Exceptional 98.1% |
| Carpatho Rusyns | 100.0 /100 | #14 | Exceptional 98.1% |
| Inupiat | 100.0 /100 | #15 | Exceptional 98.1% |
| Scottish | 100.0 /100 | #16 | Exceptional 98.1% |
| Poles | 100.0 /100 | #17 | Exceptional 98.1% |
| Pennsylvania Germans | 100.0 /100 | #18 | Exceptional 98.1% |
| Irish | 100.0 /100 | #19 | Exceptional 98.1% |
| Finns | 100.0 /100 | #20 | Exceptional 98.1% |
| Lithuanians | 100.0 /100 | #21 | Exceptional 98.1% |
| Danes | 100.0 /100 | #22 | Exceptional 98.0% |