Immigrants from Kenya vs Immigrants from the Azores Unemployment Among Women with Children Under 6 years
COMPARE
Immigrants from Kenya
Immigrants from the Azores
Unemployment Among Women with Children Under 6 years
Unemployment Among Women with Children Under 6 years Comparison
Immigrants from Kenya
Immigrants from the Azores
7.3%
UNEMPLOYMENT AMONG WOMEN WITH CHILDREN UNDER 6 YEARS
95.4/ 100
METRIC RATING
117th/ 347
METRIC RANK
9.2%
UNEMPLOYMENT AMONG WOMEN WITH CHILDREN UNDER 6 YEARS
0.0/ 100
METRIC RATING
312th/ 347
METRIC RANK
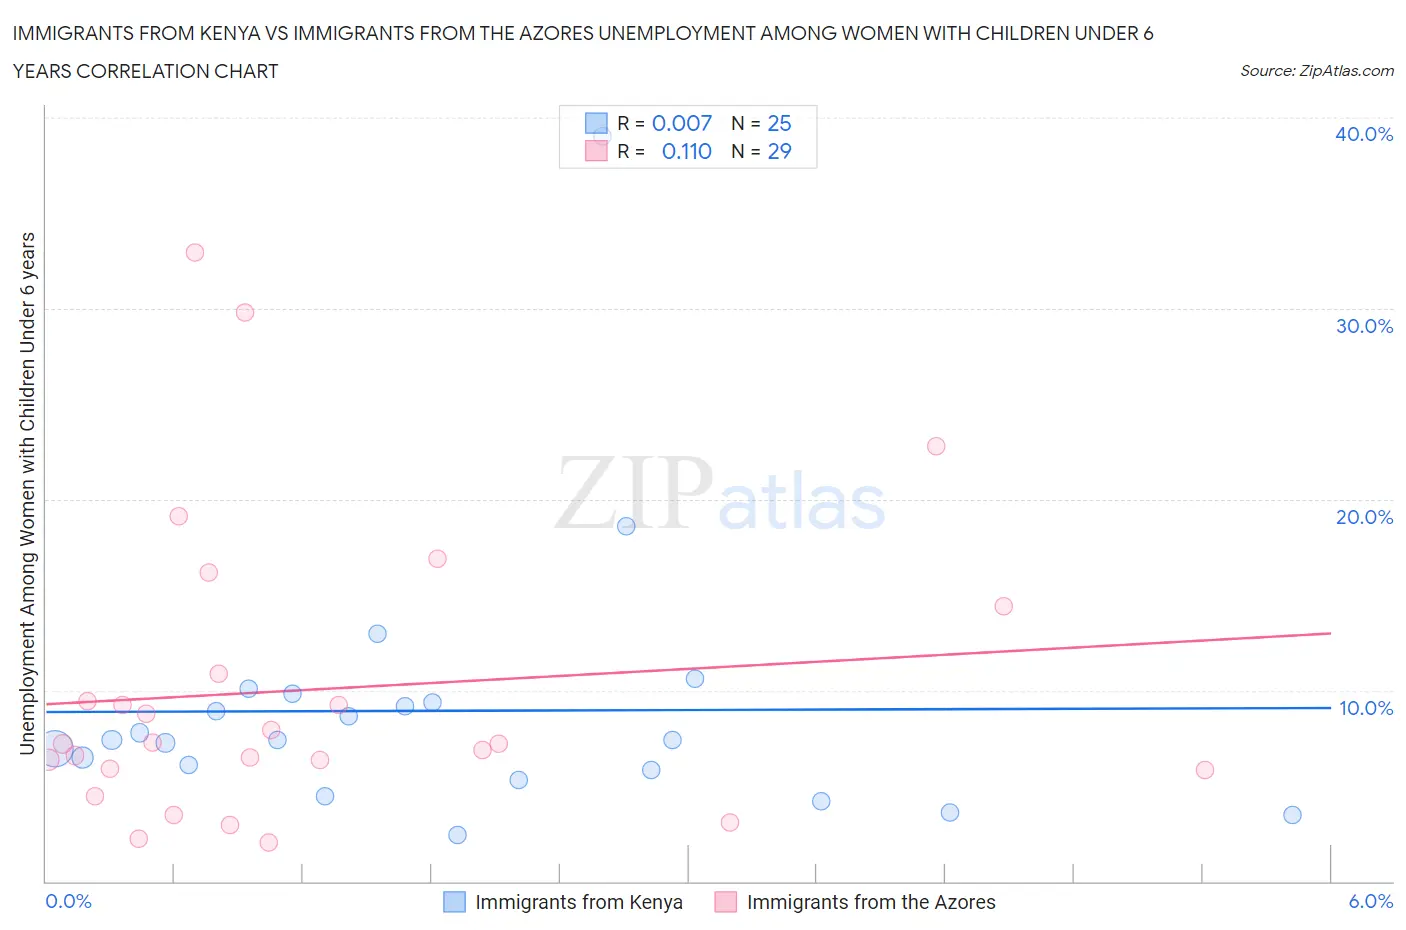
Immigrants from Kenya vs Immigrants from the Azores Unemployment Among Women with Children Under 6 years Correlation Chart
The statistical analysis conducted on geographies consisting of 185,437,277 people shows no correlation between the proportion of Immigrants from Kenya and unemployment rate among women with children under the age of 6 in the United States with a correlation coefficient (R) of 0.007 and weighted average of 7.3%. Similarly, the statistical analysis conducted on geographies consisting of 40,648,611 people shows a poor positive correlation between the proportion of Immigrants from the Azores and unemployment rate among women with children under the age of 6 in the United States with a correlation coefficient (R) of 0.110 and weighted average of 9.2%, a difference of 26.9%.
Unemployment Among Women with Children Under 6 years Correlation Summary
| Measurement | Immigrants from Kenya | Immigrants from the Azores |
| Minimum | 2.4% | 2.0% |
| Maximum | 39.0% | 32.9% |
| Range | 36.6% | 30.9% |
| Mean | 8.9% | 10.1% |
| Median | 7.4% | 7.2% |
| Interquartile 25% (IQ1) | 5.5% | 5.8% |
| Interquartile 75% (IQ3) | 9.6% | 12.6% |
| Interquartile Range (IQR) | 4.1% | 6.8% |
| Standard Deviation (Sample) | 7.1% | 7.8% |
| Standard Deviation (Population) | 7.0% | 7.6% |
Similar Demographics by Unemployment Among Women with Children Under 6 years
Demographics Similar to Immigrants from Kenya by Unemployment Among Women with Children Under 6 years
In terms of unemployment among women with children under 6 years, the demographic groups most similar to Immigrants from Kenya are Armenian (7.2%, a difference of 0.21%), Immigrants from Italy (7.2%, a difference of 0.30%), Serbian (7.3%, a difference of 0.33%), Argentinean (7.2%, a difference of 0.38%), and Nicaraguan (7.2%, a difference of 0.42%).
| Demographics | Rating | Rank | Unemployment Among Women with Children Under 6 years |
| Palestinians | 96.8 /100 | #110 | Exceptional 7.2% |
| Norwegians | 96.7 /100 | #111 | Exceptional 7.2% |
| Israelis | 96.5 /100 | #112 | Exceptional 7.2% |
| Nicaraguans | 96.3 /100 | #113 | Exceptional 7.2% |
| Argentineans | 96.2 /100 | #114 | Exceptional 7.2% |
| Immigrants | Italy | 96.1 /100 | #115 | Exceptional 7.2% |
| Armenians | 95.9 /100 | #116 | Exceptional 7.2% |
| Immigrants | Kenya | 95.4 /100 | #117 | Exceptional 7.3% |
| Serbians | 94.5 /100 | #118 | Exceptional 7.3% |
| South Africans | 94.1 /100 | #119 | Exceptional 7.3% |
| Iraqis | 93.9 /100 | #120 | Exceptional 7.3% |
| Immigrants | Chile | 93.5 /100 | #121 | Exceptional 7.3% |
| Immigrants | Bosnia and Herzegovina | 93.5 /100 | #122 | Exceptional 7.3% |
| Immigrants | Zaire | 93.3 /100 | #123 | Exceptional 7.3% |
| Immigrants | South Africa | 92.5 /100 | #124 | Exceptional 7.3% |
Demographics Similar to Immigrants from the Azores by Unemployment Among Women with Children Under 6 years
In terms of unemployment among women with children under 6 years, the demographic groups most similar to Immigrants from the Azores are French American Indian (9.2%, a difference of 0.14%), Cajun (9.2%, a difference of 0.42%), American (9.3%, a difference of 0.44%), Fijian (9.3%, a difference of 0.46%), and African (9.2%, a difference of 0.55%).
| Demographics | Rating | Rank | Unemployment Among Women with Children Under 6 years |
| Alaskan Athabascans | 0.0 /100 | #305 | Tragic 9.1% |
| Pueblo | 0.0 /100 | #306 | Tragic 9.1% |
| Dominicans | 0.0 /100 | #307 | Tragic 9.1% |
| Immigrants | Micronesia | 0.0 /100 | #308 | Tragic 9.1% |
| Africans | 0.0 /100 | #309 | Tragic 9.2% |
| Cajuns | 0.0 /100 | #310 | Tragic 9.2% |
| French American Indians | 0.0 /100 | #311 | Tragic 9.2% |
| Immigrants | Azores | 0.0 /100 | #312 | Tragic 9.2% |
| Americans | 0.0 /100 | #313 | Tragic 9.3% |
| Fijians | 0.0 /100 | #314 | Tragic 9.3% |
| Cherokee | 0.0 /100 | #315 | Tragic 9.3% |
| Houma | 0.0 /100 | #316 | Tragic 9.4% |
| Dutch West Indians | 0.0 /100 | #317 | Tragic 9.5% |
| Osage | 0.0 /100 | #318 | Tragic 9.5% |
| Marshallese | 0.0 /100 | #319 | Tragic 9.6% |