Immigrants from Kazakhstan vs Cape Verdean Child Poverty Under the Age of 5
COMPARE
Immigrants from Kazakhstan
Cape Verdean
Child Poverty Under the Age of 5
Child Poverty Under the Age of 5 Comparison
Immigrants from Kazakhstan
Cape Verdeans
15.8%
CHILD POVERTY UNDER THE AGE OF 5
96.2/ 100
METRIC RATING
96th/ 347
METRIC RANK
19.1%
CHILD POVERTY UNDER THE AGE OF 5
1.4/ 100
METRIC RATING
227th/ 347
METRIC RANK
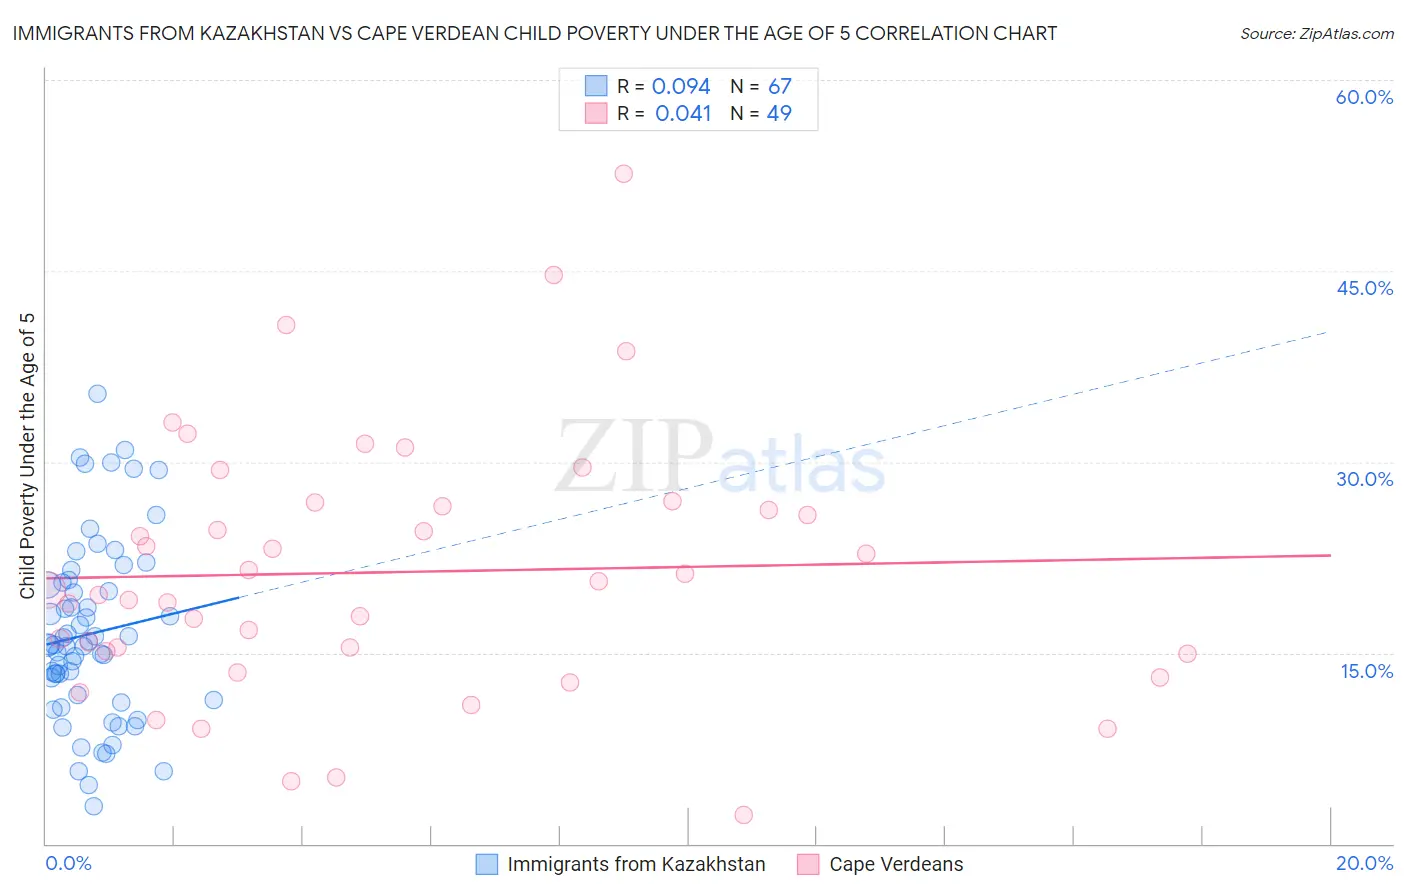
Immigrants from Kazakhstan vs Cape Verdean Child Poverty Under the Age of 5 Correlation Chart
The statistical analysis conducted on geographies consisting of 121,784,551 people shows a slight positive correlation between the proportion of Immigrants from Kazakhstan and poverty level among children under the age of 5 in the United States with a correlation coefficient (R) of 0.094 and weighted average of 15.8%. Similarly, the statistical analysis conducted on geographies consisting of 105,755,857 people shows no correlation between the proportion of Cape Verdeans and poverty level among children under the age of 5 in the United States with a correlation coefficient (R) of 0.041 and weighted average of 19.1%, a difference of 21.1%.
Child Poverty Under the Age of 5 Correlation Summary
| Measurement | Immigrants from Kazakhstan | Cape Verdean |
| Minimum | 2.9% | 2.3% |
| Maximum | 35.4% | 52.6% |
| Range | 32.4% | 50.3% |
| Mean | 16.5% | 21.3% |
| Median | 15.6% | 19.9% |
| Interquartile 25% (IQ1) | 11.3% | 15.1% |
| Interquartile 75% (IQ3) | 20.5% | 26.7% |
| Interquartile Range (IQR) | 9.2% | 11.6% |
| Standard Deviation (Sample) | 7.1% | 10.2% |
| Standard Deviation (Population) | 7.0% | 10.1% |
Similar Demographics by Child Poverty Under the Age of 5
Demographics Similar to Immigrants from Kazakhstan by Child Poverty Under the Age of 5
In terms of child poverty under the age of 5, the demographic groups most similar to Immigrants from Kazakhstan are Macedonian (15.8%, a difference of 0.040%), Immigrants from South Africa (15.8%, a difference of 0.11%), Immigrants from Switzerland (15.8%, a difference of 0.13%), Palestinian (15.8%, a difference of 0.22%), and Immigrants from Canada (15.8%, a difference of 0.24%).
| Demographics | Rating | Rank | Child Poverty Under the Age of 5 |
| Immigrants | Croatia | 97.3 /100 | #89 | Exceptional 15.6% |
| Immigrants | France | 97.3 /100 | #90 | Exceptional 15.6% |
| Poles | 97.2 /100 | #91 | Exceptional 15.7% |
| Scandinavians | 97.1 /100 | #92 | Exceptional 15.7% |
| Ukrainians | 97.1 /100 | #93 | Exceptional 15.7% |
| Immigrants | South Eastern Asia | 97.1 /100 | #94 | Exceptional 15.7% |
| Immigrants | Switzerland | 96.4 /100 | #95 | Exceptional 15.8% |
| Immigrants | Kazakhstan | 96.2 /100 | #96 | Exceptional 15.8% |
| Macedonians | 96.2 /100 | #97 | Exceptional 15.8% |
| Immigrants | South Africa | 96.1 /100 | #98 | Exceptional 15.8% |
| Palestinians | 95.9 /100 | #99 | Exceptional 15.8% |
| Immigrants | Canada | 95.9 /100 | #100 | Exceptional 15.8% |
| Immigrants | Zimbabwe | 95.9 /100 | #101 | Exceptional 15.8% |
| Armenians | 95.7 /100 | #102 | Exceptional 15.8% |
| Europeans | 95.3 /100 | #103 | Exceptional 15.9% |
Demographics Similar to Cape Verdeans by Child Poverty Under the Age of 5
In terms of child poverty under the age of 5, the demographic groups most similar to Cape Verdeans are Immigrants from Eritrea (19.1%, a difference of 0.18%), Nigerian (19.1%, a difference of 0.20%), Nicaraguan (19.1%, a difference of 0.23%), Immigrants from Sudan (19.2%, a difference of 0.30%), and Cuban (19.1%, a difference of 0.34%).
| Demographics | Rating | Rank | Child Poverty Under the Age of 5 |
| Immigrants | Azores | 2.6 /100 | #220 | Tragic 18.9% |
| Immigrants | Nigeria | 2.1 /100 | #221 | Tragic 19.0% |
| Alsatians | 1.7 /100 | #222 | Tragic 19.1% |
| Cubans | 1.7 /100 | #223 | Tragic 19.1% |
| Nicaraguans | 1.6 /100 | #224 | Tragic 19.1% |
| Nigerians | 1.6 /100 | #225 | Tragic 19.1% |
| Immigrants | Eritrea | 1.5 /100 | #226 | Tragic 19.1% |
| Cape Verdeans | 1.4 /100 | #227 | Tragic 19.1% |
| Immigrants | Sudan | 1.3 /100 | #228 | Tragic 19.2% |
| Ghanaians | 1.2 /100 | #229 | Tragic 19.2% |
| Ecuadorians | 1.2 /100 | #230 | Tragic 19.2% |
| Bermudans | 1.2 /100 | #231 | Tragic 19.2% |
| Trinidadians and Tobagonians | 0.9 /100 | #232 | Tragic 19.3% |
| Sudanese | 0.9 /100 | #233 | Tragic 19.3% |
| Immigrants | Micronesia | 0.9 /100 | #234 | Tragic 19.4% |