Immigrants from Kazakhstan vs Albanian Child Poverty Under the Age of 5
COMPARE
Immigrants from Kazakhstan
Albanian
Child Poverty Under the Age of 5
Child Poverty Under the Age of 5 Comparison
Immigrants from Kazakhstan
Albanians
15.8%
CHILD POVERTY UNDER THE AGE OF 5
96.2/ 100
METRIC RATING
96th/ 347
METRIC RANK
16.0%
CHILD POVERTY UNDER THE AGE OF 5
93.8/ 100
METRIC RATING
115th/ 347
METRIC RANK
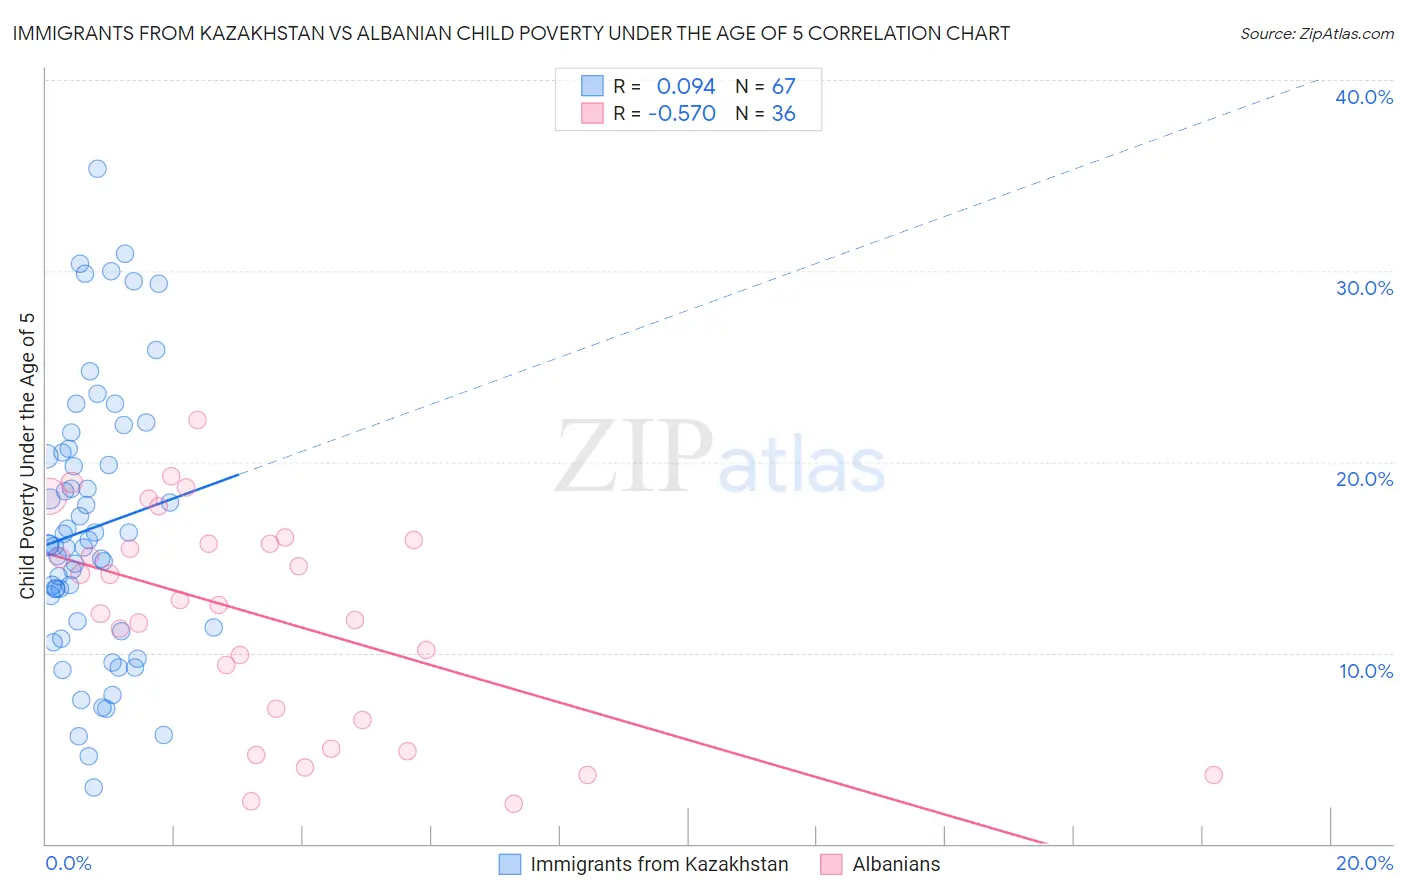
Immigrants from Kazakhstan vs Albanian Child Poverty Under the Age of 5 Correlation Chart
The statistical analysis conducted on geographies consisting of 121,784,551 people shows a slight positive correlation between the proportion of Immigrants from Kazakhstan and poverty level among children under the age of 5 in the United States with a correlation coefficient (R) of 0.094 and weighted average of 15.8%. Similarly, the statistical analysis conducted on geographies consisting of 186,792,170 people shows a substantial negative correlation between the proportion of Albanians and poverty level among children under the age of 5 in the United States with a correlation coefficient (R) of -0.570 and weighted average of 16.0%, a difference of 1.5%.
Child Poverty Under the Age of 5 Correlation Summary
| Measurement | Immigrants from Kazakhstan | Albanian |
| Minimum | 2.9% | 2.1% |
| Maximum | 35.4% | 22.2% |
| Range | 32.4% | 20.1% |
| Mean | 16.5% | 11.9% |
| Median | 15.6% | 12.6% |
| Interquartile 25% (IQ1) | 11.3% | 6.8% |
| Interquartile 75% (IQ3) | 20.5% | 15.8% |
| Interquartile Range (IQR) | 9.2% | 9.0% |
| Standard Deviation (Sample) | 7.1% | 5.6% |
| Standard Deviation (Population) | 7.0% | 5.5% |
Demographics Similar to Immigrants from Kazakhstan and Albanians by Child Poverty Under the Age of 5
In terms of child poverty under the age of 5, the demographic groups most similar to Immigrants from Kazakhstan are Macedonian (15.8%, a difference of 0.040%), Immigrants from South Africa (15.8%, a difference of 0.11%), Immigrants from Switzerland (15.8%, a difference of 0.13%), Palestinian (15.8%, a difference of 0.22%), and Immigrants from Canada (15.8%, a difference of 0.24%). Similarly, the demographic groups most similar to Albanians are Immigrants from Kuwait (16.0%, a difference of 0.020%), Puget Sound Salish (16.0%, a difference of 0.11%), Peruvian (16.0%, a difference of 0.12%), Pakistani (16.0%, a difference of 0.17%), and Northern European (16.0%, a difference of 0.21%).
| Demographics | Rating | Rank | Child Poverty Under the Age of 5 |
| Immigrants | Switzerland | 96.4 /100 | #95 | Exceptional 15.8% |
| Immigrants | Kazakhstan | 96.2 /100 | #96 | Exceptional 15.8% |
| Macedonians | 96.2 /100 | #97 | Exceptional 15.8% |
| Immigrants | South Africa | 96.1 /100 | #98 | Exceptional 15.8% |
| Palestinians | 95.9 /100 | #99 | Exceptional 15.8% |
| Immigrants | Canada | 95.9 /100 | #100 | Exceptional 15.8% |
| Immigrants | Zimbabwe | 95.9 /100 | #101 | Exceptional 15.8% |
| Armenians | 95.7 /100 | #102 | Exceptional 15.8% |
| Europeans | 95.3 /100 | #103 | Exceptional 15.9% |
| Immigrants | North America | 94.9 /100 | #104 | Exceptional 15.9% |
| Immigrants | Spain | 94.8 /100 | #105 | Exceptional 15.9% |
| Tlingit-Haida | 94.7 /100 | #106 | Exceptional 15.9% |
| Slovenes | 94.4 /100 | #107 | Exceptional 16.0% |
| Immigrants | Brazil | 94.4 /100 | #108 | Exceptional 16.0% |
| Northern Europeans | 94.3 /100 | #109 | Exceptional 16.0% |
| Romanians | 94.3 /100 | #110 | Exceptional 16.0% |
| Pakistanis | 94.2 /100 | #111 | Exceptional 16.0% |
| Peruvians | 94.1 /100 | #112 | Exceptional 16.0% |
| Puget Sound Salish | 94.1 /100 | #113 | Exceptional 16.0% |
| Immigrants | Kuwait | 93.9 /100 | #114 | Exceptional 16.0% |
| Albanians | 93.8 /100 | #115 | Exceptional 16.0% |