Immigrants from Kazakhstan vs Immigrants from Indonesia Single Male Poverty
COMPARE
Immigrants from Kazakhstan
Immigrants from Indonesia
Single Male Poverty
Single Male Poverty Comparison
Immigrants from Kazakhstan
Immigrants from Indonesia
12.2%
SINGLE MALE POVERTY
96.7/ 100
METRIC RATING
104th/ 347
METRIC RANK
11.6%
SINGLE MALE POVERTY
99.9/ 100
METRIC RATING
48th/ 347
METRIC RANK
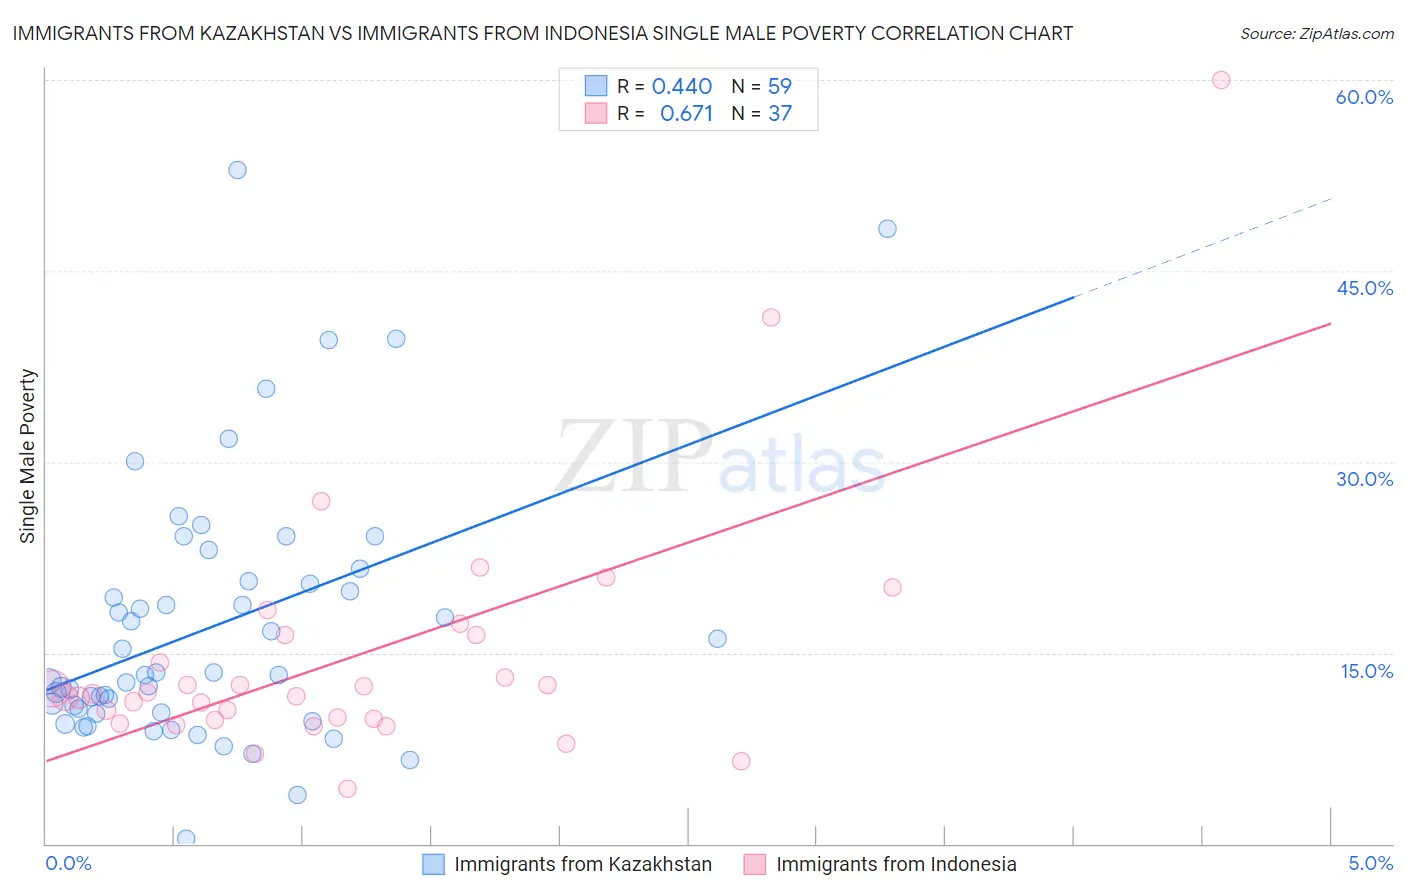
Immigrants from Kazakhstan vs Immigrants from Indonesia Single Male Poverty Correlation Chart
The statistical analysis conducted on geographies consisting of 117,184,903 people shows a moderate positive correlation between the proportion of Immigrants from Kazakhstan and poverty level among single males in the United States with a correlation coefficient (R) of 0.440 and weighted average of 12.2%. Similarly, the statistical analysis conducted on geographies consisting of 200,544,788 people shows a significant positive correlation between the proportion of Immigrants from Indonesia and poverty level among single males in the United States with a correlation coefficient (R) of 0.671 and weighted average of 11.6%, a difference of 5.4%.
Single Male Poverty Correlation Summary
| Measurement | Immigrants from Kazakhstan | Immigrants from Indonesia |
| Minimum | 0.41% | 4.3% |
| Maximum | 52.9% | 60.0% |
| Range | 52.5% | 55.7% |
| Mean | 17.1% | 14.7% |
| Median | 13.3% | 11.7% |
| Interquartile 25% (IQ1) | 10.3% | 9.8% |
| Interquartile 75% (IQ3) | 20.6% | 16.4% |
| Interquartile Range (IQR) | 10.2% | 6.6% |
| Standard Deviation (Sample) | 10.3% | 10.1% |
| Standard Deviation (Population) | 10.2% | 9.9% |
Similar Demographics by Single Male Poverty
Demographics Similar to Immigrants from Kazakhstan by Single Male Poverty
In terms of single male poverty, the demographic groups most similar to Immigrants from Kazakhstan are Immigrants from Armenia (12.2%, a difference of 0.010%), Immigrants from Europe (12.2%, a difference of 0.14%), Immigrants from Latvia (12.2%, a difference of 0.15%), Immigrants from Australia (12.2%, a difference of 0.19%), and Immigrants from Cuba (12.2%, a difference of 0.30%).
| Demographics | Rating | Rank | Single Male Poverty |
| Immigrants | Italy | 97.4 /100 | #97 | Exceptional 12.2% |
| Guamanians/Chamorros | 97.4 /100 | #98 | Exceptional 12.2% |
| Immigrants | Cuba | 97.3 /100 | #99 | Exceptional 12.2% |
| Immigrants | Australia | 97.1 /100 | #100 | Exceptional 12.2% |
| Immigrants | Latvia | 97.0 /100 | #101 | Exceptional 12.2% |
| Immigrants | Europe | 97.0 /100 | #102 | Exceptional 12.2% |
| Immigrants | Armenia | 96.7 /100 | #103 | Exceptional 12.2% |
| Immigrants | Kazakhstan | 96.7 /100 | #104 | Exceptional 12.2% |
| Jordanians | 95.9 /100 | #105 | Exceptional 12.3% |
| Immigrants | Morocco | 95.6 /100 | #106 | Exceptional 12.3% |
| Iraqis | 95.1 /100 | #107 | Exceptional 12.3% |
| Immigrants | Eastern Africa | 95.0 /100 | #108 | Exceptional 12.3% |
| Ugandans | 94.5 /100 | #109 | Exceptional 12.3% |
| Immigrants | Portugal | 93.6 /100 | #110 | Exceptional 12.3% |
| Immigrants | North Macedonia | 93.6 /100 | #111 | Exceptional 12.3% |
Demographics Similar to Immigrants from Indonesia by Single Male Poverty
In terms of single male poverty, the demographic groups most similar to Immigrants from Indonesia are Tlingit-Haida (11.6%, a difference of 0.020%), Nepalese (11.6%, a difference of 0.080%), Immigrants from Lithuania (11.6%, a difference of 0.080%), Paraguayan (11.6%, a difference of 0.19%), and Immigrants from Bulgaria (11.6%, a difference of 0.27%).
| Demographics | Rating | Rank | Single Male Poverty |
| Immigrants | Iraq | 99.9 /100 | #41 | Exceptional 11.5% |
| Egyptians | 99.9 /100 | #42 | Exceptional 11.5% |
| Immigrants | Peru | 99.9 /100 | #43 | Exceptional 11.5% |
| Immigrants | Cameroon | 99.9 /100 | #44 | Exceptional 11.5% |
| Immigrants | Poland | 99.9 /100 | #45 | Exceptional 11.5% |
| Immigrants | Bulgaria | 99.9 /100 | #46 | Exceptional 11.6% |
| Nepalese | 99.9 /100 | #47 | Exceptional 11.6% |
| Immigrants | Indonesia | 99.9 /100 | #48 | Exceptional 11.6% |
| Tlingit-Haida | 99.9 /100 | #49 | Exceptional 11.6% |
| Immigrants | Lithuania | 99.9 /100 | #50 | Exceptional 11.6% |
| Paraguayans | 99.9 /100 | #51 | Exceptional 11.6% |
| Samoans | 99.9 /100 | #52 | Exceptional 11.7% |
| Bulgarians | 99.9 /100 | #53 | Exceptional 11.7% |
| Immigrants | Uzbekistan | 99.9 /100 | #54 | Exceptional 11.7% |
| Cypriots | 99.9 /100 | #55 | Exceptional 11.7% |