Immigrants from Congo vs Immigrants from Indonesia Single Male Poverty
COMPARE
Immigrants from Congo
Immigrants from Indonesia
Single Male Poverty
Single Male Poverty Comparison
Immigrants from Congo
Immigrants from Indonesia
13.9%
SINGLE MALE POVERTY
0.2/ 100
METRIC RATING
265th/ 347
METRIC RANK
11.6%
SINGLE MALE POVERTY
99.9/ 100
METRIC RATING
48th/ 347
METRIC RANK
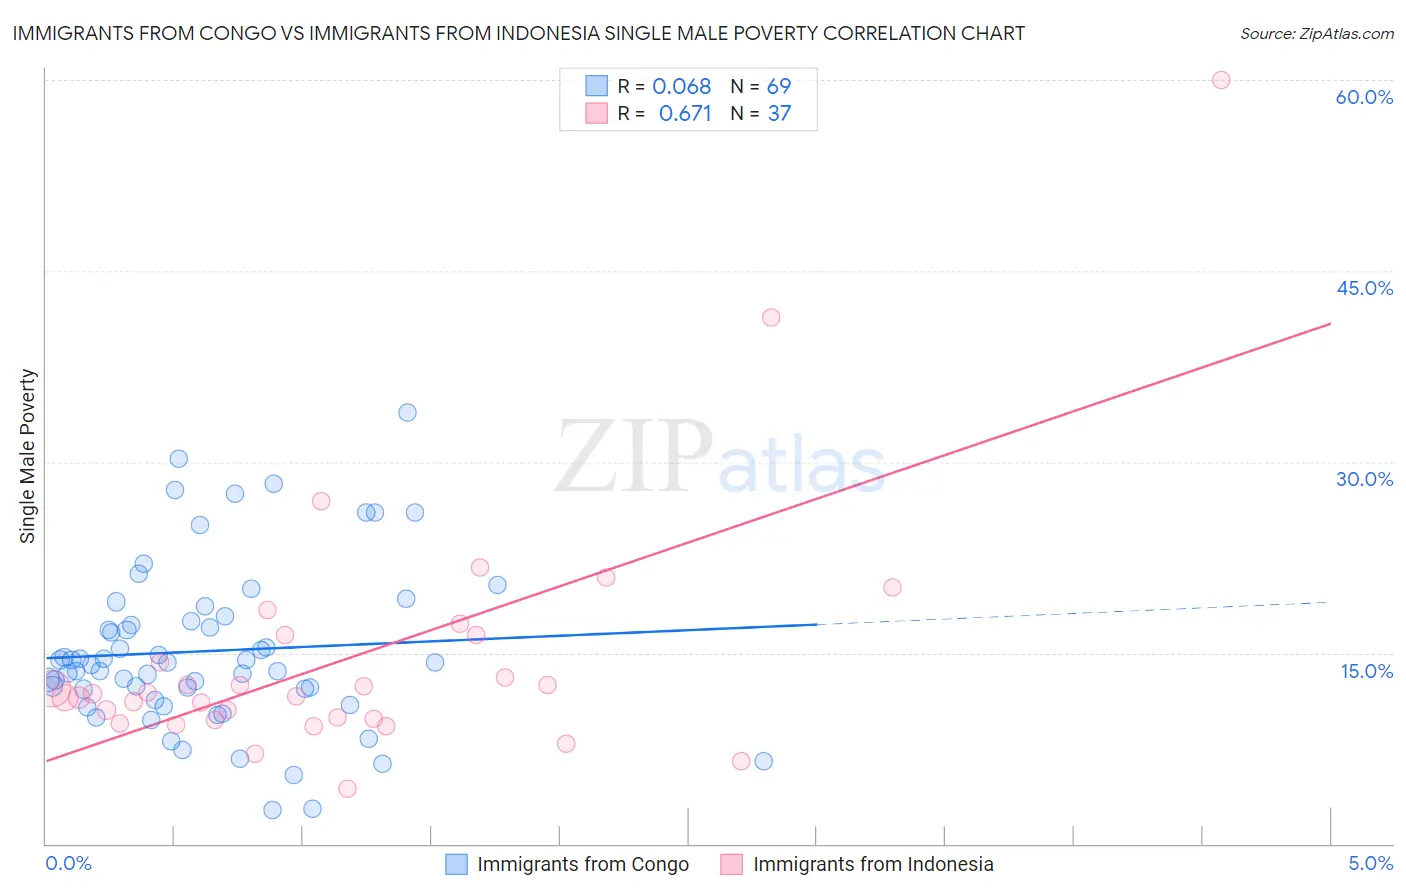
Immigrants from Congo vs Immigrants from Indonesia Single Male Poverty Correlation Chart
The statistical analysis conducted on geographies consisting of 89,882,140 people shows a slight positive correlation between the proportion of Immigrants from Congo and poverty level among single males in the United States with a correlation coefficient (R) of 0.068 and weighted average of 13.9%. Similarly, the statistical analysis conducted on geographies consisting of 200,544,788 people shows a significant positive correlation between the proportion of Immigrants from Indonesia and poverty level among single males in the United States with a correlation coefficient (R) of 0.671 and weighted average of 11.6%, a difference of 19.6%.
Single Male Poverty Correlation Summary
| Measurement | Immigrants from Congo | Immigrants from Indonesia |
| Minimum | 2.6% | 4.3% |
| Maximum | 33.9% | 60.0% |
| Range | 31.2% | 55.7% |
| Mean | 15.1% | 14.7% |
| Median | 14.3% | 11.7% |
| Interquartile 25% (IQ1) | 11.7% | 9.8% |
| Interquartile 75% (IQ3) | 17.7% | 16.4% |
| Interquartile Range (IQR) | 6.0% | 6.6% |
| Standard Deviation (Sample) | 6.4% | 10.1% |
| Standard Deviation (Population) | 6.4% | 9.9% |
Similar Demographics by Single Male Poverty
Demographics Similar to Immigrants from Congo by Single Male Poverty
In terms of single male poverty, the demographic groups most similar to Immigrants from Congo are West Indian (13.8%, a difference of 0.16%), Immigrants from Cabo Verde (13.9%, a difference of 0.31%), Cape Verdean (13.8%, a difference of 0.35%), Fijian (13.8%, a difference of 0.47%), and German (13.9%, a difference of 0.47%).
| Demographics | Rating | Rank | Single Male Poverty |
| Immigrants | Guatemala | 0.3 /100 | #258 | Tragic 13.8% |
| Guatemalans | 0.3 /100 | #259 | Tragic 13.8% |
| Swiss | 0.3 /100 | #260 | Tragic 13.8% |
| Hungarians | 0.3 /100 | #261 | Tragic 13.8% |
| Fijians | 0.3 /100 | #262 | Tragic 13.8% |
| Cape Verdeans | 0.2 /100 | #263 | Tragic 13.8% |
| West Indians | 0.2 /100 | #264 | Tragic 13.8% |
| Immigrants | Congo | 0.2 /100 | #265 | Tragic 13.9% |
| Immigrants | Cabo Verde | 0.1 /100 | #266 | Tragic 13.9% |
| Germans | 0.1 /100 | #267 | Tragic 13.9% |
| Immigrants | Mexico | 0.1 /100 | #268 | Tragic 13.9% |
| Scottish | 0.1 /100 | #269 | Tragic 14.0% |
| Immigrants | Saudi Arabia | 0.1 /100 | #270 | Tragic 14.0% |
| Irish | 0.1 /100 | #271 | Tragic 14.0% |
| Mexicans | 0.1 /100 | #272 | Tragic 14.0% |
Demographics Similar to Immigrants from Indonesia by Single Male Poverty
In terms of single male poverty, the demographic groups most similar to Immigrants from Indonesia are Tlingit-Haida (11.6%, a difference of 0.020%), Nepalese (11.6%, a difference of 0.080%), Immigrants from Lithuania (11.6%, a difference of 0.080%), Paraguayan (11.6%, a difference of 0.19%), and Immigrants from Bulgaria (11.6%, a difference of 0.27%).
| Demographics | Rating | Rank | Single Male Poverty |
| Immigrants | Iraq | 99.9 /100 | #41 | Exceptional 11.5% |
| Egyptians | 99.9 /100 | #42 | Exceptional 11.5% |
| Immigrants | Peru | 99.9 /100 | #43 | Exceptional 11.5% |
| Immigrants | Cameroon | 99.9 /100 | #44 | Exceptional 11.5% |
| Immigrants | Poland | 99.9 /100 | #45 | Exceptional 11.5% |
| Immigrants | Bulgaria | 99.9 /100 | #46 | Exceptional 11.6% |
| Nepalese | 99.9 /100 | #47 | Exceptional 11.6% |
| Immigrants | Indonesia | 99.9 /100 | #48 | Exceptional 11.6% |
| Tlingit-Haida | 99.9 /100 | #49 | Exceptional 11.6% |
| Immigrants | Lithuania | 99.9 /100 | #50 | Exceptional 11.6% |
| Paraguayans | 99.9 /100 | #51 | Exceptional 11.6% |
| Samoans | 99.9 /100 | #52 | Exceptional 11.7% |
| Bulgarians | 99.9 /100 | #53 | Exceptional 11.7% |
| Immigrants | Uzbekistan | 99.9 /100 | #54 | Exceptional 11.7% |
| Cypriots | 99.9 /100 | #55 | Exceptional 11.7% |