Immigrants from Japan vs Delaware Male Poverty
COMPARE
Immigrants from Japan
Delaware
Male Poverty
Male Poverty Comparison
Immigrants from Japan
Delaware
10.0%
MALE POVERTY
98.8/ 100
METRIC RATING
48th/ 347
METRIC RANK
11.7%
MALE POVERTY
15.4/ 100
METRIC RATING
197th/ 347
METRIC RANK
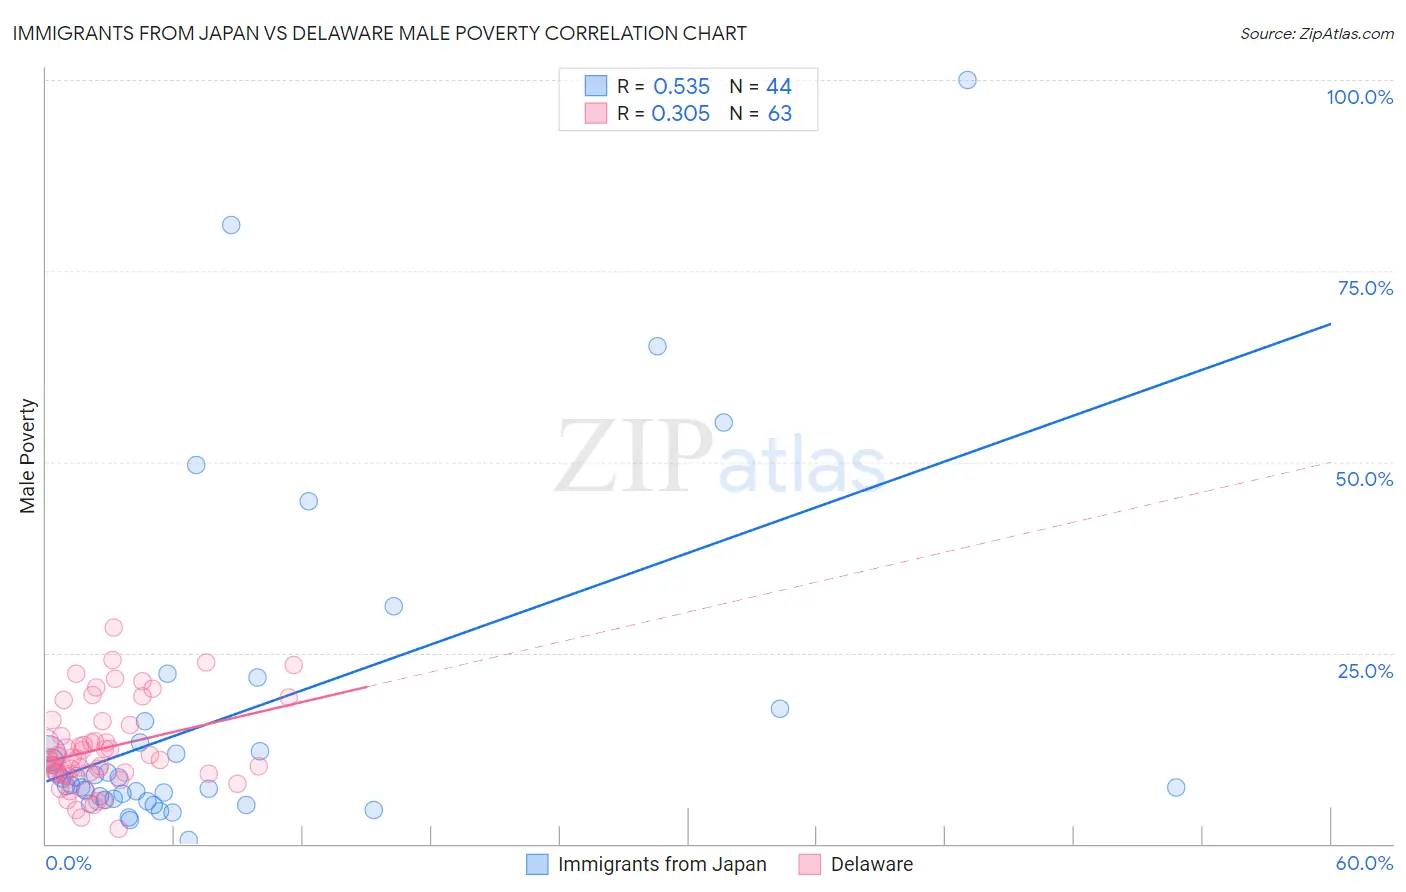
Immigrants from Japan vs Delaware Male Poverty Correlation Chart
The statistical analysis conducted on geographies consisting of 339,942,398 people shows a substantial positive correlation between the proportion of Immigrants from Japan and poverty level among males in the United States with a correlation coefficient (R) of 0.535 and weighted average of 10.0%. Similarly, the statistical analysis conducted on geographies consisting of 96,214,887 people shows a mild positive correlation between the proportion of Delaware and poverty level among males in the United States with a correlation coefficient (R) of 0.305 and weighted average of 11.7%, a difference of 16.8%.
Male Poverty Correlation Summary
| Measurement | Immigrants from Japan | Delaware |
| Minimum | 0.45% | 1.9% |
| Maximum | 100.0% | 28.2% |
| Range | 99.6% | 26.3% |
| Mean | 16.8% | 12.5% |
| Median | 8.1% | 11.2% |
| Interquartile 25% (IQ1) | 5.8% | 9.2% |
| Interquartile 75% (IQ3) | 14.6% | 15.6% |
| Interquartile Range (IQR) | 8.8% | 6.4% |
| Standard Deviation (Sample) | 21.7% | 5.6% |
| Standard Deviation (Population) | 21.5% | 5.6% |
Similar Demographics by Male Poverty
Demographics Similar to Immigrants from Japan by Male Poverty
In terms of male poverty, the demographic groups most similar to Immigrants from Japan are Immigrants from Singapore (10.0%, a difference of 0.0%), Slovene (10.0%, a difference of 0.090%), Turkish (10.0%, a difference of 0.13%), Immigrants from Philippines (10.0%, a difference of 0.14%), and Immigrants from Serbia (10.0%, a difference of 0.15%).
| Demographics | Rating | Rank | Male Poverty |
| Koreans | 99.2 /100 | #41 | Exceptional 9.9% |
| Immigrants | Iran | 99.1 /100 | #42 | Exceptional 9.9% |
| Immigrants | Moldova | 99.0 /100 | #43 | Exceptional 9.9% |
| Immigrants | Romania | 98.9 /100 | #44 | Exceptional 9.9% |
| Immigrants | Serbia | 98.9 /100 | #45 | Exceptional 10.0% |
| Turks | 98.9 /100 | #46 | Exceptional 10.0% |
| Immigrants | Singapore | 98.8 /100 | #47 | Exceptional 10.0% |
| Immigrants | Japan | 98.8 /100 | #48 | Exceptional 10.0% |
| Slovenes | 98.8 /100 | #49 | Exceptional 10.0% |
| Immigrants | Philippines | 98.7 /100 | #50 | Exceptional 10.0% |
| Immigrants | Croatia | 98.7 /100 | #51 | Exceptional 10.0% |
| Asians | 98.7 /100 | #52 | Exceptional 10.0% |
| Immigrants | Czechoslovakia | 98.6 /100 | #53 | Exceptional 10.0% |
| Immigrants | Austria | 98.5 /100 | #54 | Exceptional 10.0% |
| Germans | 98.3 /100 | #55 | Exceptional 10.1% |
Demographics Similar to Delaware by Male Poverty
In terms of male poverty, the demographic groups most similar to Delaware are Hmong (11.6%, a difference of 0.060%), Arab (11.6%, a difference of 0.070%), Immigrants from Kenya (11.6%, a difference of 0.12%), Iraqi (11.7%, a difference of 0.14%), and Spanish (11.7%, a difference of 0.24%).
| Demographics | Rating | Rank | Male Poverty |
| Israelis | 26.1 /100 | #190 | Fair 11.5% |
| South American Indians | 22.8 /100 | #191 | Fair 11.5% |
| Immigrants | Uruguay | 19.1 /100 | #192 | Poor 11.6% |
| Immigrants | Kuwait | 17.3 /100 | #193 | Poor 11.6% |
| Immigrants | Kenya | 16.1 /100 | #194 | Poor 11.6% |
| Arabs | 15.8 /100 | #195 | Poor 11.6% |
| Hmong | 15.8 /100 | #196 | Poor 11.6% |
| Delaware | 15.4 /100 | #197 | Poor 11.7% |
| Iraqis | 14.7 /100 | #198 | Poor 11.7% |
| Spanish | 14.1 /100 | #199 | Poor 11.7% |
| Immigrants | Lebanon | 13.6 /100 | #200 | Poor 11.7% |
| Spaniards | 13.5 /100 | #201 | Poor 11.7% |
| Aleuts | 10.4 /100 | #202 | Poor 11.8% |
| Immigrants | Western Asia | 9.8 /100 | #203 | Tragic 11.8% |
| Immigrants | Uganda | 8.5 /100 | #204 | Tragic 11.8% |