Immigrants from Israel vs Mexican Unemployment Among Ages 55 to 59 years
COMPARE
Immigrants from Israel
Mexican
Unemployment Among Ages 55 to 59 years
Unemployment Among Ages 55 to 59 years Comparison
Immigrants from Israel
Mexicans
5.3%
UNEMPLOYMENT AMONG AGES 55 TO 59 YEARS
0.0/ 100
METRIC RATING
288th/ 347
METRIC RANK
5.2%
UNEMPLOYMENT AMONG AGES 55 TO 59 YEARS
0.1/ 100
METRIC RATING
268th/ 347
METRIC RANK
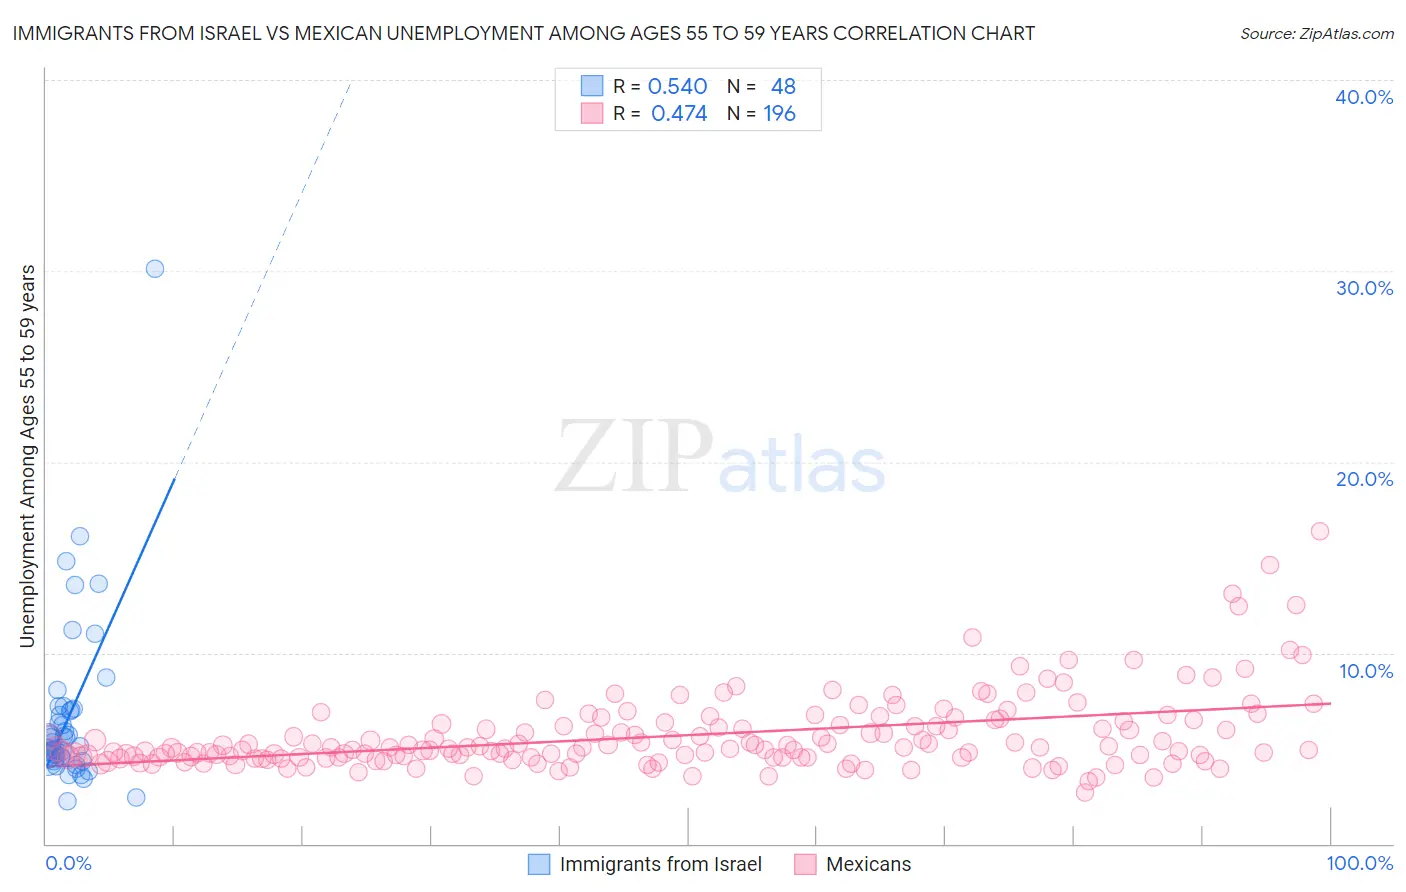
Immigrants from Israel vs Mexican Unemployment Among Ages 55 to 59 years Correlation Chart
The statistical analysis conducted on geographies consisting of 204,057,833 people shows a substantial positive correlation between the proportion of Immigrants from Israel and unemployment rate among population between the ages 55 and 59 in the United States with a correlation coefficient (R) of 0.540 and weighted average of 5.3%. Similarly, the statistical analysis conducted on geographies consisting of 485,380,600 people shows a moderate positive correlation between the proportion of Mexicans and unemployment rate among population between the ages 55 and 59 in the United States with a correlation coefficient (R) of 0.474 and weighted average of 5.2%, a difference of 2.5%.
Unemployment Among Ages 55 to 59 years Correlation Summary
| Measurement | Immigrants from Israel | Mexican |
| Minimum | 2.2% | 2.7% |
| Maximum | 30.1% | 16.4% |
| Range | 27.9% | 13.7% |
| Mean | 6.7% | 5.7% |
| Median | 5.5% | 5.0% |
| Interquartile 25% (IQ1) | 4.5% | 4.5% |
| Interquartile 75% (IQ3) | 7.0% | 6.3% |
| Interquartile Range (IQR) | 2.5% | 1.7% |
| Standard Deviation (Sample) | 4.6% | 2.0% |
| Standard Deviation (Population) | 4.6% | 2.0% |
Demographics Similar to Immigrants from Israel and Mexicans by Unemployment Among Ages 55 to 59 years
In terms of unemployment among ages 55 to 59 years, the demographic groups most similar to Immigrants from Israel are Immigrants from Guatemala (5.3%, a difference of 0.010%), Immigrants from Ghana (5.3%, a difference of 0.030%), Armenian (5.3%, a difference of 0.15%), Ghanaian (5.3%, a difference of 0.25%), and Apache (5.3%, a difference of 0.29%). Similarly, the demographic groups most similar to Mexicans are Tsimshian (5.2%, a difference of 0.020%), Ute (5.2%, a difference of 0.19%), Cree (5.2%, a difference of 0.49%), Immigrants from Jamaica (5.2%, a difference of 0.67%), and Ottawa (5.2%, a difference of 0.90%).
| Demographics | Rating | Rank | Unemployment Among Ages 55 to 59 years |
| Mexicans | 0.1 /100 | #268 | Tragic 5.2% |
| Tsimshian | 0.1 /100 | #269 | Tragic 5.2% |
| Ute | 0.1 /100 | #270 | Tragic 5.2% |
| Cree | 0.1 /100 | #271 | Tragic 5.2% |
| Immigrants | Jamaica | 0.0 /100 | #272 | Tragic 5.2% |
| Ottawa | 0.0 /100 | #273 | Tragic 5.2% |
| Mexican American Indians | 0.0 /100 | #274 | Tragic 5.2% |
| Israelis | 0.0 /100 | #275 | Tragic 5.2% |
| West Indians | 0.0 /100 | #276 | Tragic 5.2% |
| Immigrants | Latin America | 0.0 /100 | #277 | Tragic 5.2% |
| Immigrants | Barbados | 0.0 /100 | #278 | Tragic 5.2% |
| Alsatians | 0.0 /100 | #279 | Tragic 5.2% |
| Immigrants | Uzbekistan | 0.0 /100 | #280 | Tragic 5.3% |
| Guatemalans | 0.0 /100 | #281 | Tragic 5.3% |
| Immigrants | Trinidad and Tobago | 0.0 /100 | #282 | Tragic 5.3% |
| Apache | 0.0 /100 | #283 | Tragic 5.3% |
| Ghanaians | 0.0 /100 | #284 | Tragic 5.3% |
| Armenians | 0.0 /100 | #285 | Tragic 5.3% |
| Immigrants | Ghana | 0.0 /100 | #286 | Tragic 5.3% |
| Immigrants | Guatemala | 0.0 /100 | #287 | Tragic 5.3% |
| Immigrants | Israel | 0.0 /100 | #288 | Tragic 5.3% |