Immigrants from Iraq vs Sierra Leonean Receiving Food Stamps
COMPARE
Immigrants from Iraq
Sierra Leonean
Receiving Food Stamps
Receiving Food Stamps Comparison
Immigrants from Iraq
Sierra Leoneans
12.0%
RECEIVING FOOD STAMPS
37.1/ 100
METRIC RATING
185th/ 347
METRIC RANK
12.2%
RECEIVING FOOD STAMPS
23.6/ 100
METRIC RATING
200th/ 347
METRIC RANK
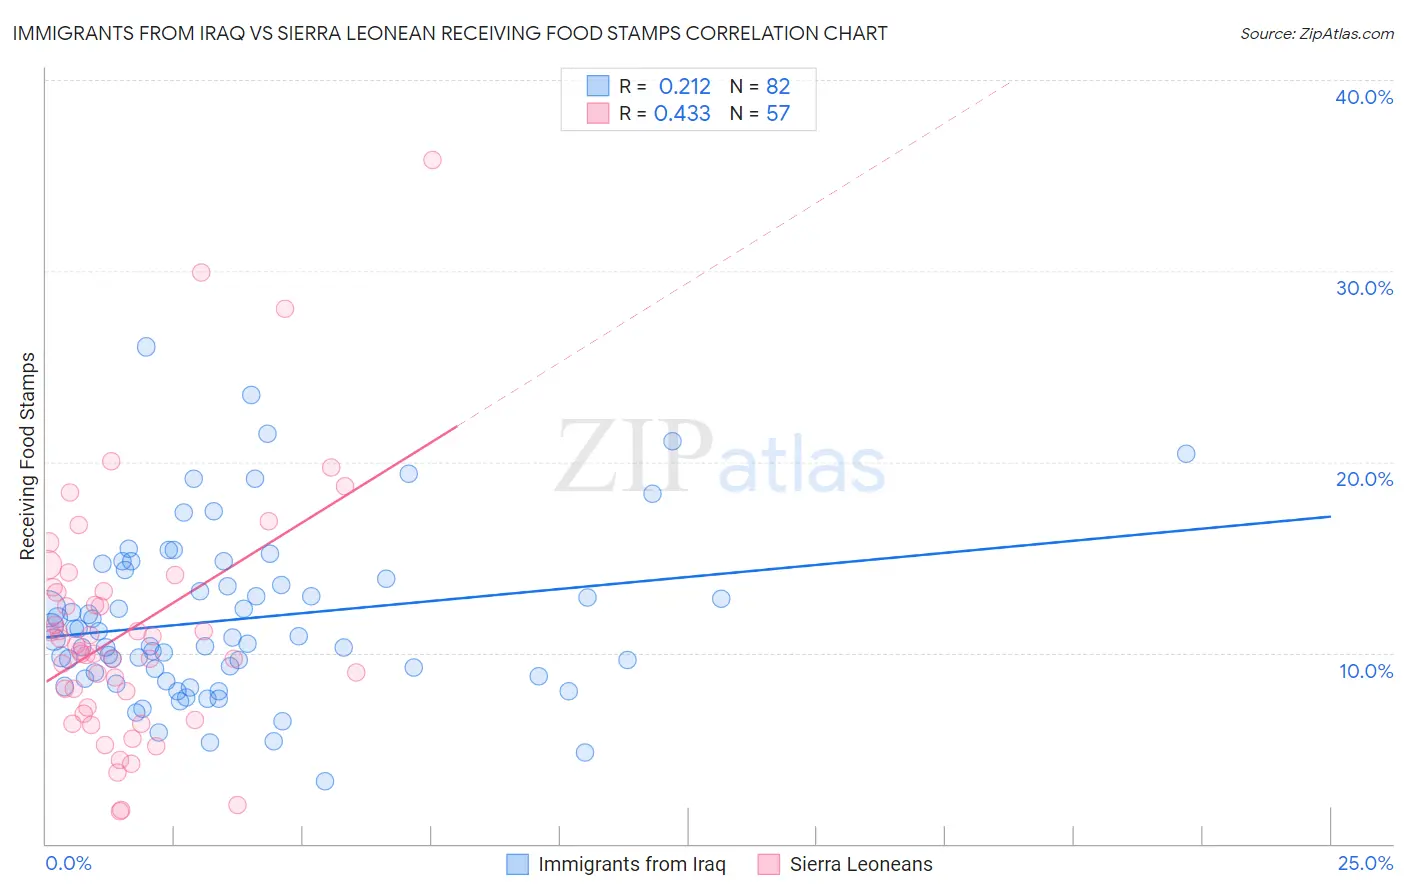
Immigrants from Iraq vs Sierra Leonean Receiving Food Stamps Correlation Chart
The statistical analysis conducted on geographies consisting of 194,550,826 people shows a weak positive correlation between the proportion of Immigrants from Iraq and percentage of population receiving government assistance and/or food stamps in the United States with a correlation coefficient (R) of 0.212 and weighted average of 12.0%. Similarly, the statistical analysis conducted on geographies consisting of 83,305,066 people shows a moderate positive correlation between the proportion of Sierra Leoneans and percentage of population receiving government assistance and/or food stamps in the United States with a correlation coefficient (R) of 0.433 and weighted average of 12.2%, a difference of 2.2%.
Receiving Food Stamps Correlation Summary
| Measurement | Immigrants from Iraq | Sierra Leonean |
| Minimum | 3.3% | 1.7% |
| Maximum | 26.0% | 35.8% |
| Range | 22.7% | 34.1% |
| Mean | 11.7% | 11.2% |
| Median | 10.7% | 10.1% |
| Interquartile 25% (IQ1) | 8.8% | 7.0% |
| Interquartile 75% (IQ3) | 13.9% | 13.3% |
| Interquartile Range (IQR) | 5.1% | 6.3% |
| Standard Deviation (Sample) | 4.4% | 6.5% |
| Standard Deviation (Population) | 4.4% | 6.4% |
Demographics Similar to Immigrants from Iraq and Sierra Leoneans by Receiving Food Stamps
In terms of receiving food stamps, the demographic groups most similar to Immigrants from Iraq are Spanish (12.0%, a difference of 0.040%), Albanian (12.0%, a difference of 0.25%), Spaniard (11.9%, a difference of 0.38%), Immigrants from Uganda (11.9%, a difference of 0.46%), and Immigrants from Morocco (11.9%, a difference of 0.52%). Similarly, the demographic groups most similar to Sierra Leoneans are Ugandan (12.2%, a difference of 0.20%), Portuguese (12.2%, a difference of 0.28%), Immigrants from Costa Rica (12.2%, a difference of 0.32%), Delaware (12.2%, a difference of 0.46%), and Iraqi (12.2%, a difference of 0.54%).
| Demographics | Rating | Rank | Receiving Food Stamps |
| Immigrants | Morocco | 40.7 /100 | #182 | Average 11.9% |
| Immigrants | Uganda | 40.3 /100 | #183 | Average 11.9% |
| Spaniards | 39.8 /100 | #184 | Fair 11.9% |
| Immigrants | Iraq | 37.1 /100 | #185 | Fair 12.0% |
| Spanish | 36.9 /100 | #186 | Fair 12.0% |
| Albanians | 35.4 /100 | #187 | Fair 12.0% |
| Sudanese | 33.4 /100 | #188 | Fair 12.0% |
| Immigrants | Cameroon | 32.5 /100 | #189 | Fair 12.0% |
| Immigrants | Peru | 32.2 /100 | #190 | Fair 12.0% |
| Venezuelans | 32.1 /100 | #191 | Fair 12.0% |
| Samoans | 31.0 /100 | #192 | Fair 12.1% |
| Immigrants | Fiji | 27.8 /100 | #193 | Fair 12.1% |
| Immigrants | Sudan | 27.1 /100 | #194 | Fair 12.1% |
| Americans | 26.7 /100 | #195 | Fair 12.2% |
| Iraqis | 26.6 /100 | #196 | Fair 12.2% |
| Delaware | 26.1 /100 | #197 | Fair 12.2% |
| Immigrants | Costa Rica | 25.4 /100 | #198 | Fair 12.2% |
| Portuguese | 25.1 /100 | #199 | Fair 12.2% |
| Sierra Leoneans | 23.6 /100 | #200 | Fair 12.2% |
| Ugandans | 22.5 /100 | #201 | Fair 12.2% |
| Immigrants | Venezuela | 20.1 /100 | #202 | Fair 12.3% |