Immigrants from Iraq vs Sierra Leonean 10th Grade
COMPARE
Immigrants from Iraq
Sierra Leonean
10th Grade
10th Grade Comparison
Immigrants from Iraq
Sierra Leoneans
93.8%
10TH GRADE
63.0/ 100
METRIC RATING
166th/ 347
METRIC RANK
93.7%
10TH GRADE
46.1/ 100
METRIC RATING
178th/ 347
METRIC RANK
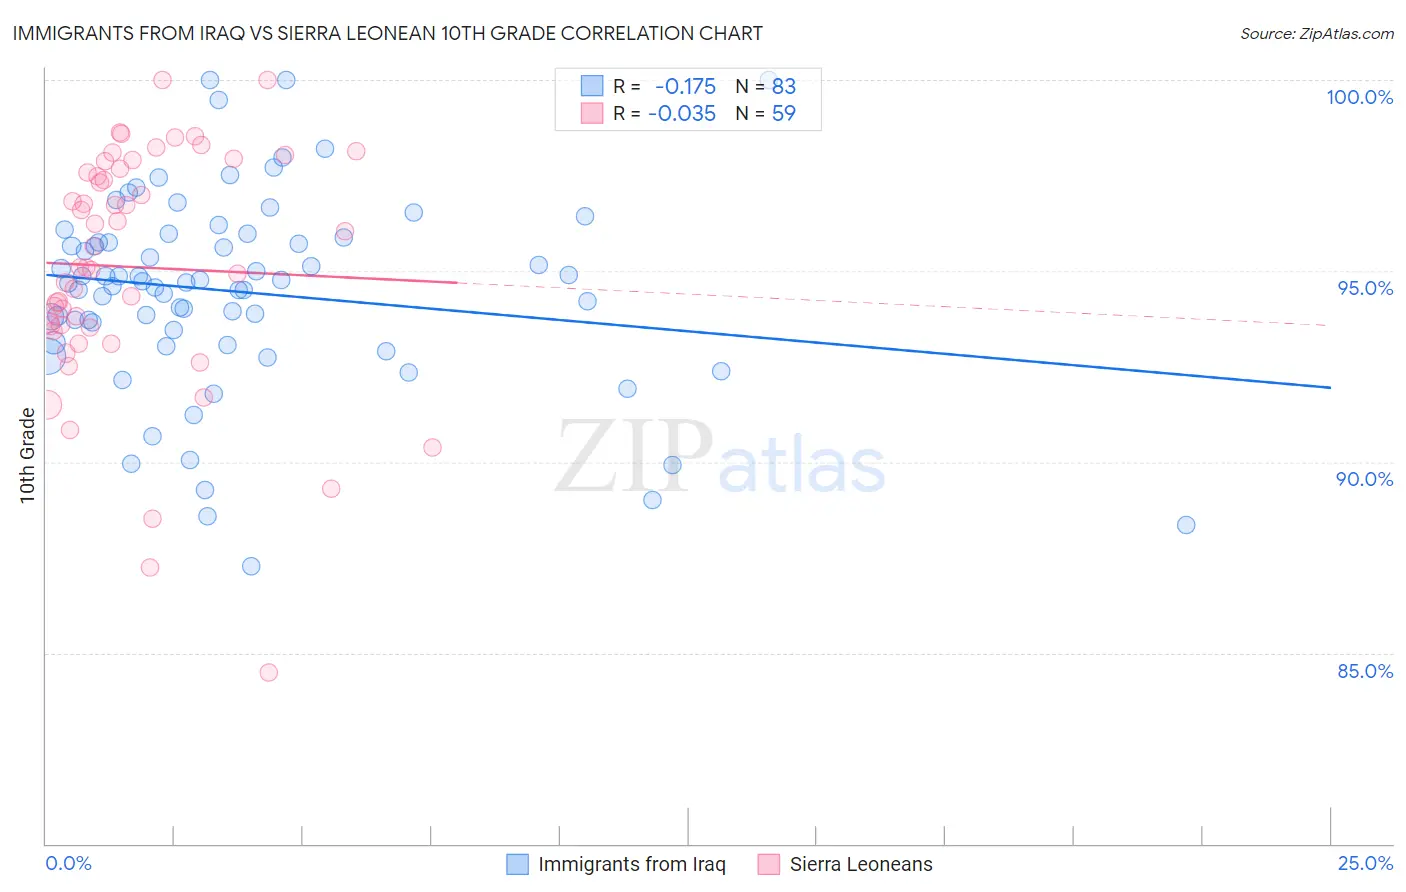
Immigrants from Iraq vs Sierra Leonean 10th Grade Correlation Chart
The statistical analysis conducted on geographies consisting of 194,632,332 people shows a poor negative correlation between the proportion of Immigrants from Iraq and percentage of population with at least 10th grade education in the United States with a correlation coefficient (R) of -0.175 and weighted average of 93.8%. Similarly, the statistical analysis conducted on geographies consisting of 83,357,120 people shows no correlation between the proportion of Sierra Leoneans and percentage of population with at least 10th grade education in the United States with a correlation coefficient (R) of -0.035 and weighted average of 93.7%, a difference of 0.15%.
10th Grade Correlation Summary
| Measurement | Immigrants from Iraq | Sierra Leonean |
| Minimum | 87.3% | 84.5% |
| Maximum | 100.0% | 100.0% |
| Range | 12.7% | 15.5% |
| Mean | 94.4% | 95.1% |
| Median | 94.7% | 95.1% |
| Interquartile 25% (IQ1) | 93.1% | 93.5% |
| Interquartile 75% (IQ3) | 95.9% | 97.7% |
| Interquartile Range (IQR) | 2.8% | 4.2% |
| Standard Deviation (Sample) | 2.6% | 3.2% |
| Standard Deviation (Population) | 2.6% | 3.1% |
Demographics Similar to Immigrants from Iraq and Sierra Leoneans by 10th Grade
In terms of 10th grade, the demographic groups most similar to Immigrants from Iraq are Brazilian (93.8%, a difference of 0.010%), Immigrants from Egypt (93.8%, a difference of 0.010%), Alsatian (93.8%, a difference of 0.030%), Iraqi (93.9%, a difference of 0.050%), and Immigrants from Poland (93.9%, a difference of 0.070%). Similarly, the demographic groups most similar to Sierra Leoneans are Immigrants from Argentina (93.7%, a difference of 0.010%), Immigrants from Lebanon (93.7%, a difference of 0.010%), Paraguayan (93.7%, a difference of 0.010%), Argentinean (93.7%, a difference of 0.030%), and Immigrants from Nepal (93.7%, a difference of 0.030%).
| Demographics | Rating | Rank | 10th Grade |
| Immigrants | Poland | 69.6 /100 | #162 | Good 93.9% |
| Venezuelans | 69.5 /100 | #163 | Good 93.9% |
| Iraqis | 68.1 /100 | #164 | Good 93.9% |
| Brazilians | 63.6 /100 | #165 | Good 93.8% |
| Immigrants | Iraq | 63.0 /100 | #166 | Good 93.8% |
| Immigrants | Egypt | 62.3 /100 | #167 | Good 93.8% |
| Alsatians | 59.4 /100 | #168 | Average 93.8% |
| Immigrants | Spain | 55.9 /100 | #169 | Average 93.8% |
| Immigrants | Venezuela | 53.9 /100 | #170 | Average 93.8% |
| Immigrants | Albania | 52.4 /100 | #171 | Average 93.8% |
| French American Indians | 50.9 /100 | #172 | Average 93.7% |
| Spaniards | 50.3 /100 | #173 | Average 93.7% |
| Argentineans | 50.0 /100 | #174 | Average 93.7% |
| Immigrants | Nepal | 49.6 /100 | #175 | Average 93.7% |
| Immigrants | Argentina | 47.1 /100 | #176 | Average 93.7% |
| Immigrants | Lebanon | 47.1 /100 | #177 | Average 93.7% |
| Sierra Leoneans | 46.1 /100 | #178 | Average 93.7% |
| Paraguayans | 45.3 /100 | #179 | Average 93.7% |
| Blackfeet | 42.8 /100 | #180 | Average 93.7% |
| Immigrants | Northern Africa | 41.6 /100 | #181 | Average 93.7% |
| Colville | 38.8 /100 | #182 | Fair 93.6% |