Tohono O'odham vs Sierra Leonean Receiving Food Stamps
COMPARE
Tohono O'odham
Sierra Leonean
Receiving Food Stamps
Receiving Food Stamps Comparison
Tohono O'odham
Sierra Leoneans
21.5%
RECEIVING FOOD STAMPS
0.0/ 100
METRIC RATING
340th/ 347
METRIC RANK
12.2%
RECEIVING FOOD STAMPS
23.6/ 100
METRIC RATING
200th/ 347
METRIC RANK
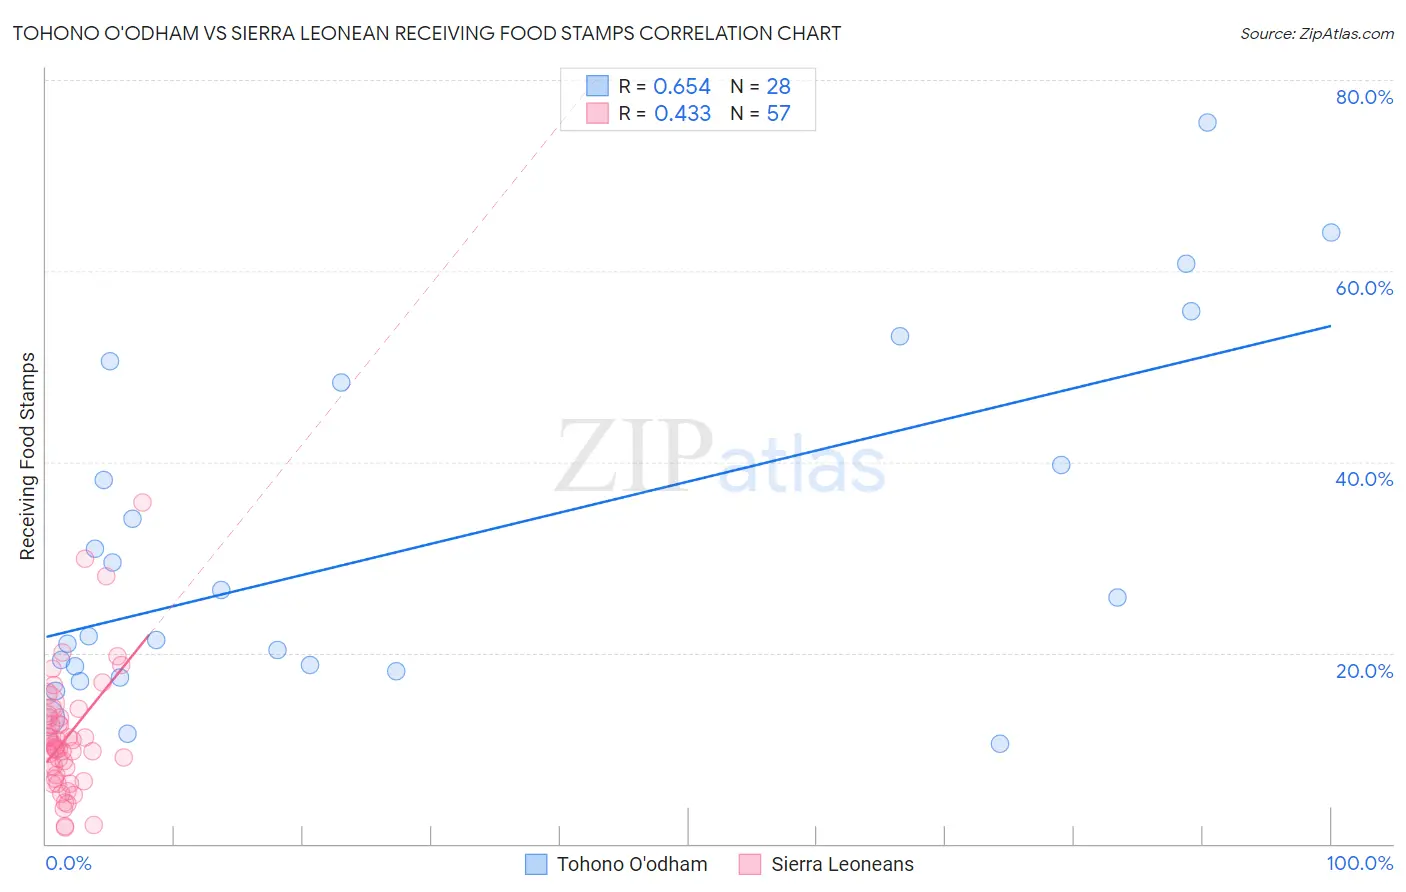
Tohono O'odham vs Sierra Leonean Receiving Food Stamps Correlation Chart
The statistical analysis conducted on geographies consisting of 58,698,945 people shows a significant positive correlation between the proportion of Tohono O'odham and percentage of population receiving government assistance and/or food stamps in the United States with a correlation coefficient (R) of 0.654 and weighted average of 21.5%. Similarly, the statistical analysis conducted on geographies consisting of 83,305,066 people shows a moderate positive correlation between the proportion of Sierra Leoneans and percentage of population receiving government assistance and/or food stamps in the United States with a correlation coefficient (R) of 0.433 and weighted average of 12.2%, a difference of 75.7%.
Receiving Food Stamps Correlation Summary
| Measurement | Tohono O'odham | Sierra Leonean |
| Minimum | 10.5% | 1.7% |
| Maximum | 75.6% | 35.8% |
| Range | 65.1% | 34.1% |
| Mean | 31.3% | 11.2% |
| Median | 23.7% | 10.1% |
| Interquartile 25% (IQ1) | 18.4% | 7.0% |
| Interquartile 75% (IQ3) | 44.0% | 13.3% |
| Interquartile Range (IQR) | 25.6% | 6.3% |
| Standard Deviation (Sample) | 17.9% | 6.5% |
| Standard Deviation (Population) | 17.6% | 6.4% |
Similar Demographics by Receiving Food Stamps
Demographics Similar to Tohono O'odham by Receiving Food Stamps
In terms of receiving food stamps, the demographic groups most similar to Tohono O'odham are Yakama (21.4%, a difference of 0.26%), Hopi (21.6%, a difference of 0.37%), Dominican (21.4%, a difference of 0.52%), Immigrants from Yemen (21.6%, a difference of 0.78%), and Cape Verdean (21.1%, a difference of 1.9%).
| Demographics | Rating | Rank | Receiving Food Stamps |
| Inupiat | 0.0 /100 | #333 | Tragic 20.1% |
| Yuman | 0.0 /100 | #334 | Tragic 20.2% |
| Immigrants | Cuba | 0.0 /100 | #335 | Tragic 20.8% |
| Navajo | 0.0 /100 | #336 | Tragic 21.1% |
| Cape Verdeans | 0.0 /100 | #337 | Tragic 21.1% |
| Dominicans | 0.0 /100 | #338 | Tragic 21.4% |
| Yakama | 0.0 /100 | #339 | Tragic 21.4% |
| Tohono O'odham | 0.0 /100 | #340 | Tragic 21.5% |
| Hopi | 0.0 /100 | #341 | Tragic 21.6% |
| Immigrants | Yemen | 0.0 /100 | #342 | Tragic 21.6% |
| Immigrants | Dominican Republic | 0.0 /100 | #343 | Tragic 22.1% |
| Lumbee | 0.0 /100 | #344 | Tragic 22.9% |
| Immigrants | Cabo Verde | 0.0 /100 | #345 | Tragic 23.8% |
| Puerto Ricans | 0.0 /100 | #346 | Tragic 26.0% |
| Yup'ik | 0.0 /100 | #347 | Tragic 32.7% |
Demographics Similar to Sierra Leoneans by Receiving Food Stamps
In terms of receiving food stamps, the demographic groups most similar to Sierra Leoneans are Ugandan (12.2%, a difference of 0.20%), Portuguese (12.2%, a difference of 0.28%), Immigrants from Costa Rica (12.2%, a difference of 0.32%), Delaware (12.2%, a difference of 0.46%), and Iraqi (12.2%, a difference of 0.54%).
| Demographics | Rating | Rank | Receiving Food Stamps |
| Immigrants | Fiji | 27.8 /100 | #193 | Fair 12.1% |
| Immigrants | Sudan | 27.1 /100 | #194 | Fair 12.1% |
| Americans | 26.7 /100 | #195 | Fair 12.2% |
| Iraqis | 26.6 /100 | #196 | Fair 12.2% |
| Delaware | 26.1 /100 | #197 | Fair 12.2% |
| Immigrants | Costa Rica | 25.4 /100 | #198 | Fair 12.2% |
| Portuguese | 25.1 /100 | #199 | Fair 12.2% |
| Sierra Leoneans | 23.6 /100 | #200 | Fair 12.2% |
| Ugandans | 22.5 /100 | #201 | Fair 12.2% |
| Immigrants | Venezuela | 20.1 /100 | #202 | Fair 12.3% |
| Shoshone | 17.7 /100 | #203 | Poor 12.4% |
| Immigrants | Nonimmigrants | 17.6 /100 | #204 | Poor 12.4% |
| Aleuts | 17.3 /100 | #205 | Poor 12.4% |
| Immigrants | Thailand | 17.0 /100 | #206 | Poor 12.4% |
| South Americans | 16.0 /100 | #207 | Poor 12.4% |