Immigrants from Indonesia vs Tohono O'odham Family Poverty
COMPARE
Immigrants from Indonesia
Tohono O'odham
Family Poverty
Family Poverty Comparison
Immigrants from Indonesia
Tohono O'odham
8.1%
FAMILY POVERTY
95.7/ 100
METRIC RATING
102nd/ 347
METRIC RANK
20.4%
FAMILY POVERTY
0.0/ 100
METRIC RATING
347th/ 347
METRIC RANK
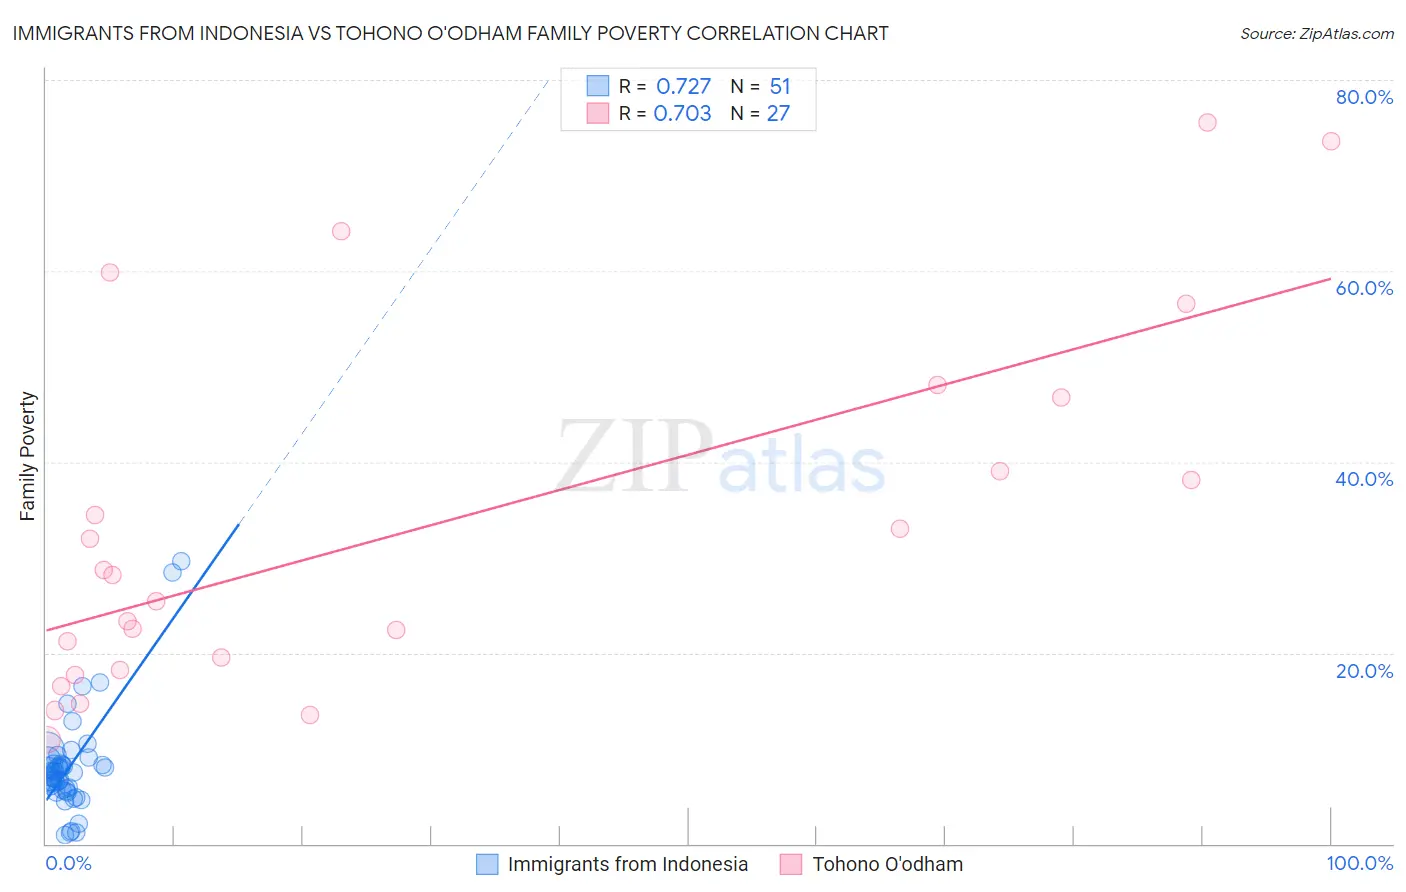
Immigrants from Indonesia vs Tohono O'odham Family Poverty Correlation Chart
The statistical analysis conducted on geographies consisting of 215,549,629 people shows a strong positive correlation between the proportion of Immigrants from Indonesia and poverty level among families in the United States with a correlation coefficient (R) of 0.727 and weighted average of 8.1%. Similarly, the statistical analysis conducted on geographies consisting of 58,710,760 people shows a strong positive correlation between the proportion of Tohono O'odham and poverty level among families in the United States with a correlation coefficient (R) of 0.703 and weighted average of 20.4%, a difference of 152.1%.
Family Poverty Correlation Summary
| Measurement | Immigrants from Indonesia | Tohono O'odham |
| Minimum | 0.98% | 10.9% |
| Maximum | 29.6% | 75.6% |
| Range | 28.6% | 64.7% |
| Mean | 8.1% | 33.2% |
| Median | 7.4% | 28.2% |
| Interquartile 25% (IQ1) | 5.6% | 18.3% |
| Interquartile 75% (IQ3) | 8.4% | 46.7% |
| Interquartile Range (IQR) | 2.8% | 28.5% |
| Standard Deviation (Sample) | 5.4% | 18.8% |
| Standard Deviation (Population) | 5.3% | 18.5% |
Similar Demographics by Family Poverty
Demographics Similar to Immigrants from Indonesia by Family Poverty
In terms of family poverty, the demographic groups most similar to Immigrants from Indonesia are Immigrants from Norway (8.1%, a difference of 0.010%), New Zealander (8.1%, a difference of 0.040%), Immigrants from Eastern Europe (8.1%, a difference of 0.090%), Slavic (8.1%, a difference of 0.10%), and Welsh (8.1%, a difference of 0.11%).
| Demographics | Rating | Rank | Family Poverty |
| Immigrants | Philippines | 96.5 /100 | #95 | Exceptional 8.0% |
| Immigrants | Turkey | 96.5 /100 | #96 | Exceptional 8.0% |
| Immigrants | Switzerland | 96.1 /100 | #97 | Exceptional 8.1% |
| Immigrants | South Africa | 95.9 /100 | #98 | Exceptional 8.1% |
| Welsh | 95.8 /100 | #99 | Exceptional 8.1% |
| New Zealanders | 95.8 /100 | #100 | Exceptional 8.1% |
| Immigrants | Norway | 95.7 /100 | #101 | Exceptional 8.1% |
| Immigrants | Indonesia | 95.7 /100 | #102 | Exceptional 8.1% |
| Immigrants | Eastern Europe | 95.6 /100 | #103 | Exceptional 8.1% |
| Slavs | 95.6 /100 | #104 | Exceptional 8.1% |
| Laotians | 95.6 /100 | #105 | Exceptional 8.1% |
| Egyptians | 95.1 /100 | #106 | Exceptional 8.1% |
| French Canadians | 95.0 /100 | #107 | Exceptional 8.1% |
| Basques | 94.9 /100 | #108 | Exceptional 8.1% |
| Jordanians | 94.8 /100 | #109 | Exceptional 8.2% |
Demographics Similar to Tohono O'odham by Family Poverty
In terms of family poverty, the demographic groups most similar to Tohono O'odham are Puerto Rican (20.3%, a difference of 0.37%), Navajo (18.8%, a difference of 8.5%), Yup'ik (18.7%, a difference of 9.0%), Pima (18.4%, a difference of 11.1%), and Immigrants from Yemen (17.5%, a difference of 16.8%).
| Demographics | Rating | Rank | Family Poverty |
| Immigrants | Dominican Republic | 0.0 /100 | #333 | Tragic 14.4% |
| Houma | 0.0 /100 | #334 | Tragic 14.6% |
| Apache | 0.0 /100 | #335 | Tragic 14.7% |
| Sioux | 0.0 /100 | #336 | Tragic 15.9% |
| Hopi | 0.0 /100 | #337 | Tragic 15.9% |
| Crow | 0.0 /100 | #338 | Tragic 16.1% |
| Yuman | 0.0 /100 | #339 | Tragic 16.6% |
| Pueblo | 0.0 /100 | #340 | Tragic 17.0% |
| Lumbee | 0.0 /100 | #341 | Tragic 17.0% |
| Immigrants | Yemen | 0.0 /100 | #342 | Tragic 17.5% |
| Pima | 0.0 /100 | #343 | Tragic 18.4% |
| Yup'ik | 0.0 /100 | #344 | Tragic 18.7% |
| Navajo | 0.0 /100 | #345 | Tragic 18.8% |
| Puerto Ricans | 0.0 /100 | #346 | Tragic 20.3% |
| Tohono O'odham | 0.0 /100 | #347 | Tragic 20.4% |