Immigrants from Indonesia vs Ukrainian 2nd Grade
COMPARE
Immigrants from Indonesia
Ukrainian
2nd Grade
2nd Grade Comparison
Immigrants from Indonesia
Ukrainians
97.5%
2ND GRADE
1.2/ 100
METRIC RATING
242nd/ 347
METRIC RANK
98.2%
2ND GRADE
98.9/ 100
METRIC RATING
89th/ 347
METRIC RANK
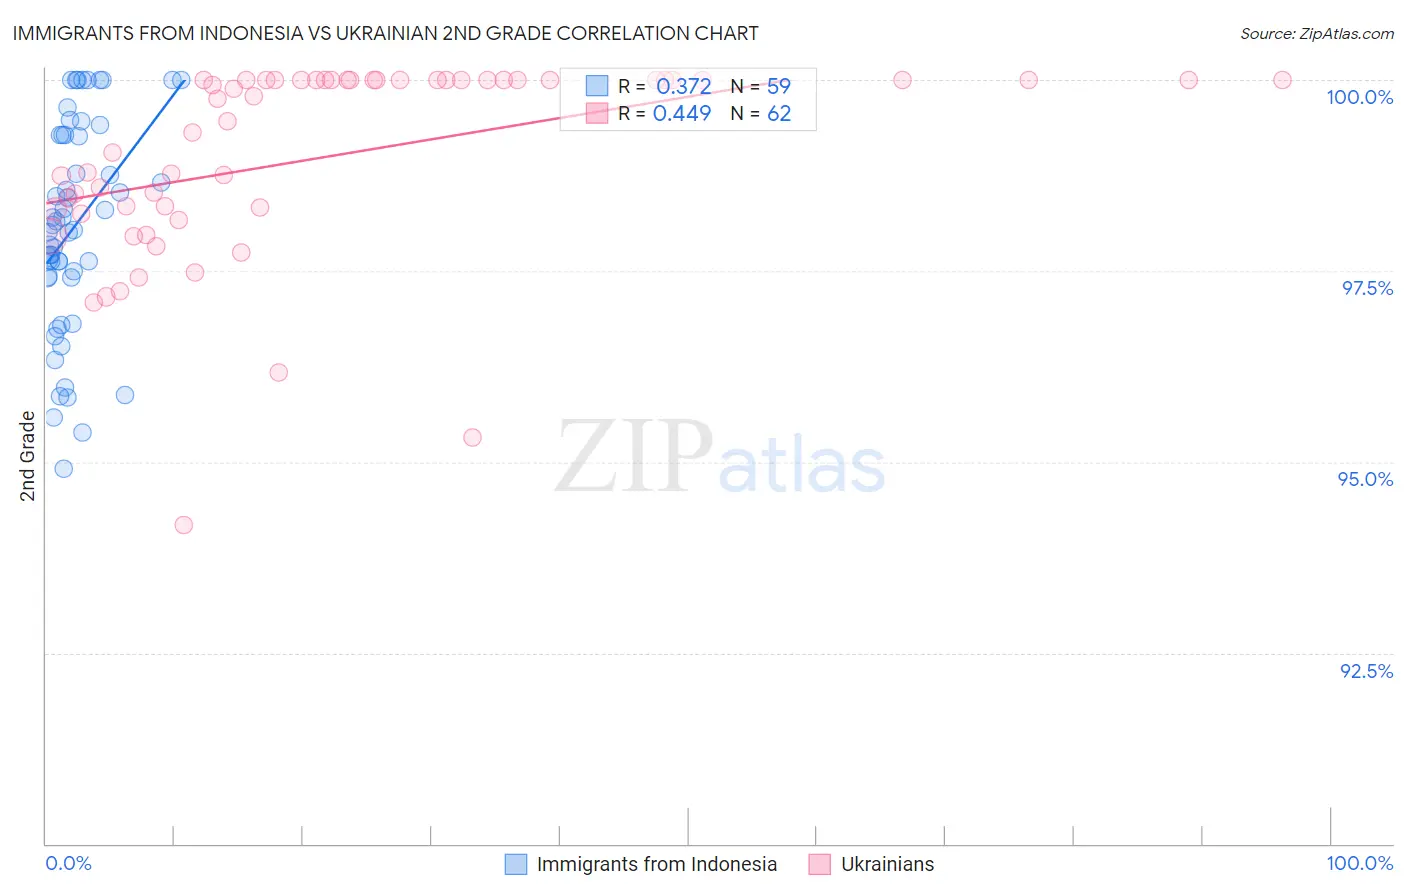
Immigrants from Indonesia vs Ukrainian 2nd Grade Correlation Chart
The statistical analysis conducted on geographies consisting of 215,782,971 people shows a mild positive correlation between the proportion of Immigrants from Indonesia and percentage of population with at least 2nd grade education in the United States with a correlation coefficient (R) of 0.372 and weighted average of 97.5%. Similarly, the statistical analysis conducted on geographies consisting of 448,698,169 people shows a moderate positive correlation between the proportion of Ukrainians and percentage of population with at least 2nd grade education in the United States with a correlation coefficient (R) of 0.449 and weighted average of 98.2%, a difference of 0.70%.
2nd Grade Correlation Summary
| Measurement | Immigrants from Indonesia | Ukrainian |
| Minimum | 94.9% | 94.2% |
| Maximum | 100.0% | 100.0% |
| Range | 5.1% | 5.8% |
| Mean | 98.1% | 99.0% |
| Median | 98.1% | 99.8% |
| Interquartile 25% (IQ1) | 97.4% | 98.3% |
| Interquartile 75% (IQ3) | 99.3% | 100.0% |
| Interquartile Range (IQR) | 1.9% | 1.7% |
| Standard Deviation (Sample) | 1.4% | 1.3% |
| Standard Deviation (Population) | 1.3% | 1.3% |
Similar Demographics by 2nd Grade
Demographics Similar to Immigrants from Indonesia by 2nd Grade
In terms of 2nd grade, the demographic groups most similar to Immigrants from Indonesia are Ethiopian (97.5%, a difference of 0.0%), Korean (97.5%, a difference of 0.010%), Asian (97.5%, a difference of 0.010%), Nigerian (97.6%, a difference of 0.020%), and U.S. Virgin Islander (97.6%, a difference of 0.020%).
| Demographics | Rating | Rank | 2nd Grade |
| Colombians | 1.9 /100 | #235 | Tragic 97.6% |
| Nigerians | 1.7 /100 | #236 | Tragic 97.6% |
| U.S. Virgin Islanders | 1.6 /100 | #237 | Tragic 97.6% |
| Immigrants | Eastern Asia | 1.6 /100 | #238 | Tragic 97.6% |
| Liberians | 1.6 /100 | #239 | Tragic 97.6% |
| Koreans | 1.5 /100 | #240 | Tragic 97.5% |
| Ethiopians | 1.2 /100 | #241 | Tragic 97.5% |
| Immigrants | Indonesia | 1.2 /100 | #242 | Tragic 97.5% |
| Asians | 1.1 /100 | #243 | Tragic 97.5% |
| Immigrants | Iraq | 1.0 /100 | #244 | Tragic 97.5% |
| Immigrants | Eastern Africa | 0.9 /100 | #245 | Tragic 97.5% |
| South Americans | 0.9 /100 | #246 | Tragic 97.5% |
| Immigrants | Senegal | 0.9 /100 | #247 | Tragic 97.5% |
| Immigrants | Middle Africa | 0.9 /100 | #248 | Tragic 97.5% |
| Bolivians | 0.9 /100 | #249 | Tragic 97.5% |
Demographics Similar to Ukrainians by 2nd Grade
In terms of 2nd grade, the demographic groups most similar to Ukrainians are Macedonian (98.2%, a difference of 0.0%), Delaware (98.2%, a difference of 0.010%), Immigrants from Sweden (98.2%, a difference of 0.010%), Hopi (98.2%, a difference of 0.010%), and Potawatomi (98.2%, a difference of 0.010%).
| Demographics | Rating | Rank | 2nd Grade |
| Delaware | 99.1 /100 | #82 | Exceptional 98.2% |
| Immigrants | Sweden | 99.1 /100 | #83 | Exceptional 98.2% |
| Hopi | 99.1 /100 | #84 | Exceptional 98.2% |
| Potawatomi | 99.1 /100 | #85 | Exceptional 98.2% |
| Immigrants | Australia | 99.0 /100 | #86 | Exceptional 98.2% |
| Immigrants | Denmark | 99.0 /100 | #87 | Exceptional 98.2% |
| Macedonians | 99.0 /100 | #88 | Exceptional 98.2% |
| Ukrainians | 98.9 /100 | #89 | Exceptional 98.2% |
| Zimbabweans | 98.8 /100 | #90 | Exceptional 98.2% |
| Immigrants | Western Europe | 98.8 /100 | #91 | Exceptional 98.2% |
| Immigrants | South Africa | 98.8 /100 | #92 | Exceptional 98.2% |
| Immigrants | India | 98.8 /100 | #93 | Exceptional 98.2% |
| Immigrants | Germany | 98.6 /100 | #94 | Exceptional 98.2% |
| South Africans | 98.6 /100 | #95 | Exceptional 98.2% |
| Cypriots | 98.4 /100 | #96 | Exceptional 98.2% |