Immigrants from India vs Ugandan Receiving Food Stamps
COMPARE
Immigrants from India
Ugandan
Receiving Food Stamps
Receiving Food Stamps Comparison
Immigrants from India
Ugandans
7.4%
RECEIVING FOOD STAMPS
100.0/ 100
METRIC RATING
2nd/ 347
METRIC RANK
12.2%
RECEIVING FOOD STAMPS
22.5/ 100
METRIC RATING
201st/ 347
METRIC RANK
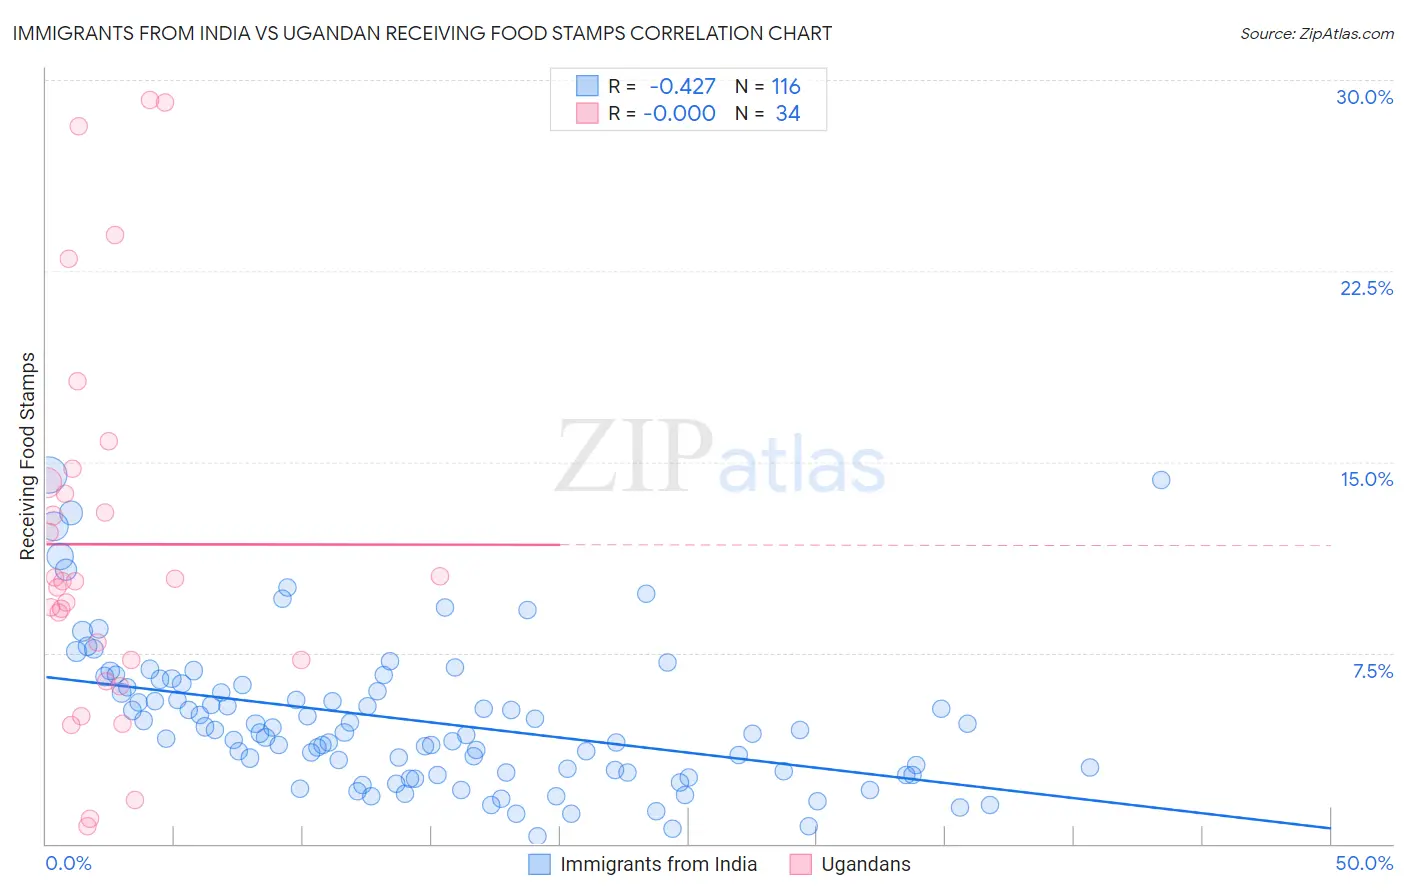
Immigrants from India vs Ugandan Receiving Food Stamps Correlation Chart
The statistical analysis conducted on geographies consisting of 432,357,413 people shows a moderate negative correlation between the proportion of Immigrants from India and percentage of population receiving government assistance and/or food stamps in the United States with a correlation coefficient (R) of -0.427 and weighted average of 7.4%. Similarly, the statistical analysis conducted on geographies consisting of 93,990,866 people shows no correlation between the proportion of Ugandans and percentage of population receiving government assistance and/or food stamps in the United States with a correlation coefficient (R) of -0.000 and weighted average of 12.2%, a difference of 66.0%.
Receiving Food Stamps Correlation Summary
| Measurement | Immigrants from India | Ugandan |
| Minimum | 0.30% | 0.70% |
| Maximum | 14.5% | 29.2% |
| Range | 14.2% | 28.5% |
| Mean | 4.8% | 11.8% |
| Median | 4.4% | 10.3% |
| Interquartile 25% (IQ1) | 2.8% | 7.2% |
| Interquartile 75% (IQ3) | 6.2% | 14.2% |
| Interquartile Range (IQR) | 3.4% | 7.0% |
| Standard Deviation (Sample) | 2.8% | 7.5% |
| Standard Deviation (Population) | 2.8% | 7.4% |
Similar Demographics by Receiving Food Stamps
Demographics Similar to Immigrants from India by Receiving Food Stamps
In terms of receiving food stamps, the demographic groups most similar to Immigrants from India are Filipino (7.4%, a difference of 0.28%), Immigrants from Taiwan (7.3%, a difference of 0.87%), Iranian (7.9%, a difference of 7.6%), Thai (8.1%, a difference of 10.0%), and Immigrants from Singapore (8.3%, a difference of 12.6%).
| Demographics | Rating | Rank | Receiving Food Stamps |
| Immigrants | Taiwan | 100.0 /100 | #1 | Exceptional 7.3% |
| Immigrants | India | 100.0 /100 | #2 | Exceptional 7.4% |
| Filipinos | 100.0 /100 | #3 | Exceptional 7.4% |
| Iranians | 100.0 /100 | #4 | Exceptional 7.9% |
| Thais | 100.0 /100 | #5 | Exceptional 8.1% |
| Immigrants | Singapore | 100.0 /100 | #6 | Exceptional 8.3% |
| Immigrants | Iran | 100.0 /100 | #7 | Exceptional 8.3% |
| Burmese | 99.9 /100 | #8 | Exceptional 8.6% |
| Immigrants | Korea | 99.9 /100 | #9 | Exceptional 8.7% |
| Immigrants | South Central Asia | 99.9 /100 | #10 | Exceptional 8.8% |
| Okinawans | 99.9 /100 | #11 | Exceptional 8.9% |
| Cypriots | 99.9 /100 | #12 | Exceptional 8.9% |
| Bulgarians | 99.9 /100 | #13 | Exceptional 8.9% |
| Maltese | 99.9 /100 | #14 | Exceptional 8.9% |
| Norwegians | 99.9 /100 | #15 | Exceptional 9.0% |
Demographics Similar to Ugandans by Receiving Food Stamps
In terms of receiving food stamps, the demographic groups most similar to Ugandans are Sierra Leonean (12.2%, a difference of 0.20%), Portuguese (12.2%, a difference of 0.48%), Immigrants from Venezuela (12.3%, a difference of 0.48%), Immigrants from Costa Rica (12.2%, a difference of 0.52%), and Delaware (12.2%, a difference of 0.66%).
| Demographics | Rating | Rank | Receiving Food Stamps |
| Immigrants | Sudan | 27.1 /100 | #194 | Fair 12.1% |
| Americans | 26.7 /100 | #195 | Fair 12.2% |
| Iraqis | 26.6 /100 | #196 | Fair 12.2% |
| Delaware | 26.1 /100 | #197 | Fair 12.2% |
| Immigrants | Costa Rica | 25.4 /100 | #198 | Fair 12.2% |
| Portuguese | 25.1 /100 | #199 | Fair 12.2% |
| Sierra Leoneans | 23.6 /100 | #200 | Fair 12.2% |
| Ugandans | 22.5 /100 | #201 | Fair 12.2% |
| Immigrants | Venezuela | 20.1 /100 | #202 | Fair 12.3% |
| Shoshone | 17.7 /100 | #203 | Poor 12.4% |
| Immigrants | Nonimmigrants | 17.6 /100 | #204 | Poor 12.4% |
| Aleuts | 17.3 /100 | #205 | Poor 12.4% |
| Immigrants | Thailand | 17.0 /100 | #206 | Poor 12.4% |
| South Americans | 16.0 /100 | #207 | Poor 12.4% |
| Potawatomi | 14.6 /100 | #208 | Poor 12.5% |