Immigrants from India vs Australian Receiving Food Stamps
COMPARE
Immigrants from India
Australian
Receiving Food Stamps
Receiving Food Stamps Comparison
Immigrants from India
Australians
7.4%
RECEIVING FOOD STAMPS
100.0/ 100
METRIC RATING
2nd/ 347
METRIC RANK
9.6%
RECEIVING FOOD STAMPS
99.4/ 100
METRIC RATING
46th/ 347
METRIC RANK
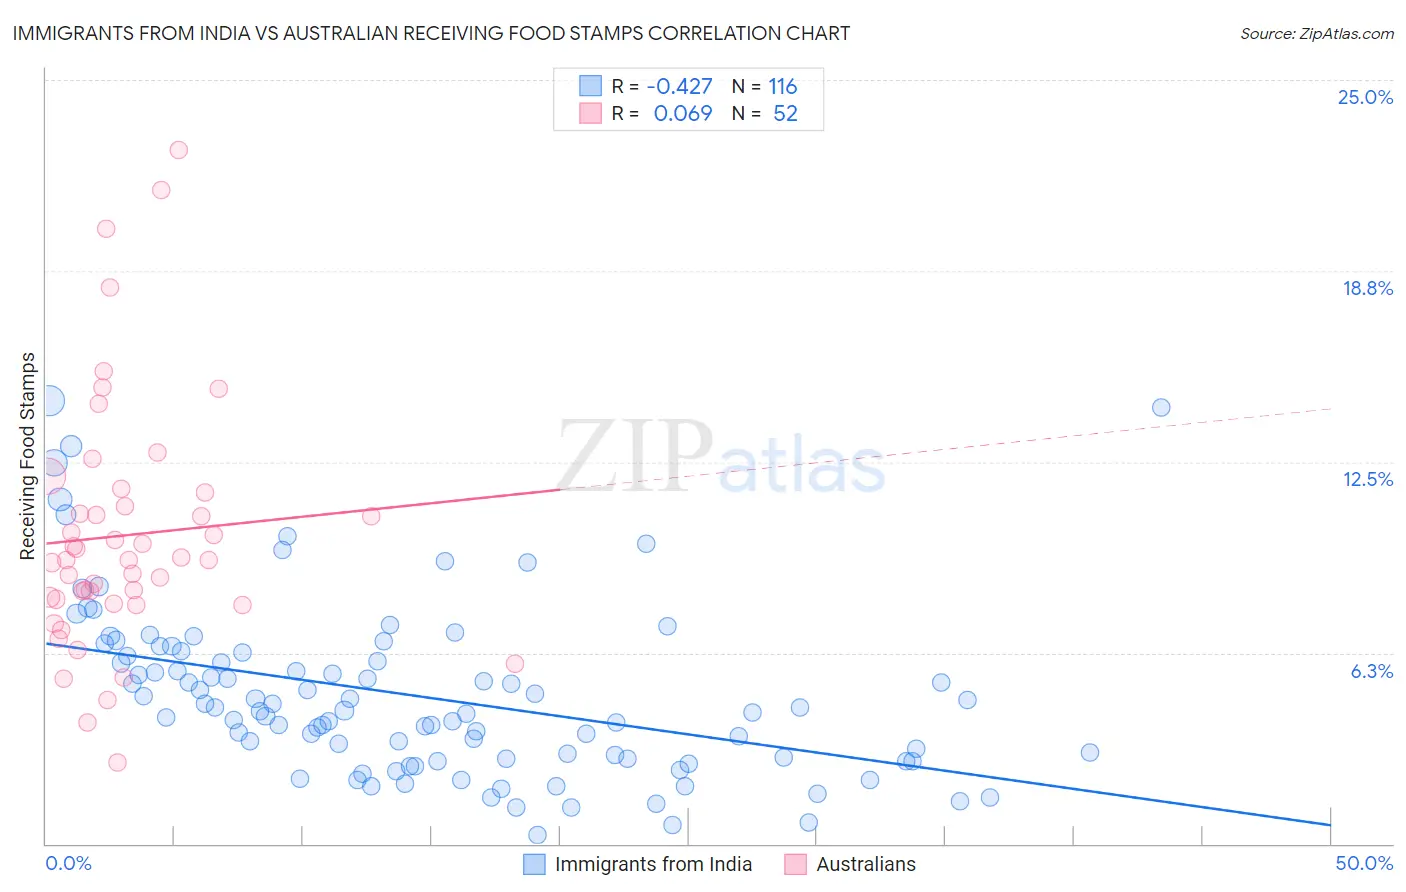
Immigrants from India vs Australian Receiving Food Stamps Correlation Chart
The statistical analysis conducted on geographies consisting of 432,357,413 people shows a moderate negative correlation between the proportion of Immigrants from India and percentage of population receiving government assistance and/or food stamps in the United States with a correlation coefficient (R) of -0.427 and weighted average of 7.4%. Similarly, the statistical analysis conducted on geographies consisting of 223,620,943 people shows a slight positive correlation between the proportion of Australians and percentage of population receiving government assistance and/or food stamps in the United States with a correlation coefficient (R) of 0.069 and weighted average of 9.6%, a difference of 30.5%.
Receiving Food Stamps Correlation Summary
| Measurement | Immigrants from India | Australian |
| Minimum | 0.30% | 2.7% |
| Maximum | 14.5% | 22.7% |
| Range | 14.2% | 20.0% |
| Mean | 4.8% | 10.1% |
| Median | 4.4% | 9.3% |
| Interquartile 25% (IQ1) | 2.8% | 7.9% |
| Interquartile 75% (IQ3) | 6.2% | 11.3% |
| Interquartile Range (IQR) | 3.4% | 3.3% |
| Standard Deviation (Sample) | 2.8% | 4.1% |
| Standard Deviation (Population) | 2.8% | 4.0% |
Similar Demographics by Receiving Food Stamps
Demographics Similar to Immigrants from India by Receiving Food Stamps
In terms of receiving food stamps, the demographic groups most similar to Immigrants from India are Filipino (7.4%, a difference of 0.28%), Immigrants from Taiwan (7.3%, a difference of 0.87%), Iranian (7.9%, a difference of 7.6%), Thai (8.1%, a difference of 10.0%), and Immigrants from Singapore (8.3%, a difference of 12.6%).
| Demographics | Rating | Rank | Receiving Food Stamps |
| Immigrants | Taiwan | 100.0 /100 | #1 | Exceptional 7.3% |
| Immigrants | India | 100.0 /100 | #2 | Exceptional 7.4% |
| Filipinos | 100.0 /100 | #3 | Exceptional 7.4% |
| Iranians | 100.0 /100 | #4 | Exceptional 7.9% |
| Thais | 100.0 /100 | #5 | Exceptional 8.1% |
| Immigrants | Singapore | 100.0 /100 | #6 | Exceptional 8.3% |
| Immigrants | Iran | 100.0 /100 | #7 | Exceptional 8.3% |
| Burmese | 99.9 /100 | #8 | Exceptional 8.6% |
| Immigrants | Korea | 99.9 /100 | #9 | Exceptional 8.7% |
| Immigrants | South Central Asia | 99.9 /100 | #10 | Exceptional 8.8% |
| Okinawans | 99.9 /100 | #11 | Exceptional 8.9% |
| Cypriots | 99.9 /100 | #12 | Exceptional 8.9% |
| Bulgarians | 99.9 /100 | #13 | Exceptional 8.9% |
| Maltese | 99.9 /100 | #14 | Exceptional 8.9% |
| Norwegians | 99.9 /100 | #15 | Exceptional 9.0% |
Demographics Similar to Australians by Receiving Food Stamps
In terms of receiving food stamps, the demographic groups most similar to Australians are Indian (Asian) (9.6%, a difference of 0.070%), Immigrants from Belgium (9.6%, a difference of 0.080%), Immigrants from Denmark (9.6%, a difference of 0.11%), Russian (9.6%, a difference of 0.17%), and Immigrants from Czechoslovakia (9.6%, a difference of 0.19%).
| Demographics | Rating | Rank | Receiving Food Stamps |
| Immigrants | Bolivia | 99.5 /100 | #39 | Exceptional 9.5% |
| Immigrants | Netherlands | 99.5 /100 | #40 | Exceptional 9.5% |
| Cambodians | 99.5 /100 | #41 | Exceptional 9.5% |
| Immigrants | China | 99.5 /100 | #42 | Exceptional 9.6% |
| Croatians | 99.5 /100 | #43 | Exceptional 9.6% |
| Immigrants | Denmark | 99.4 /100 | #44 | Exceptional 9.6% |
| Immigrants | Belgium | 99.4 /100 | #45 | Exceptional 9.6% |
| Australians | 99.4 /100 | #46 | Exceptional 9.6% |
| Indians (Asian) | 99.4 /100 | #47 | Exceptional 9.6% |
| Russians | 99.4 /100 | #48 | Exceptional 9.6% |
| Immigrants | Czechoslovakia | 99.4 /100 | #49 | Exceptional 9.6% |
| Lithuanians | 99.4 /100 | #50 | Exceptional 9.7% |
| Asians | 99.3 /100 | #51 | Exceptional 9.7% |
| Immigrants | South Africa | 99.3 /100 | #52 | Exceptional 9.7% |
| Tongans | 99.3 /100 | #53 | Exceptional 9.7% |