Immigrants from Japan vs Immigrants from Thailand Poverty
COMPARE
Immigrants from Japan
Immigrants from Thailand
Poverty
Poverty Comparison
Immigrants from Japan
Immigrants from Thailand
11.0%
POVERTY
98.9/ 100
METRIC RATING
49th/ 347
METRIC RANK
13.3%
POVERTY
3.1/ 100
METRIC RATING
218th/ 347
METRIC RANK
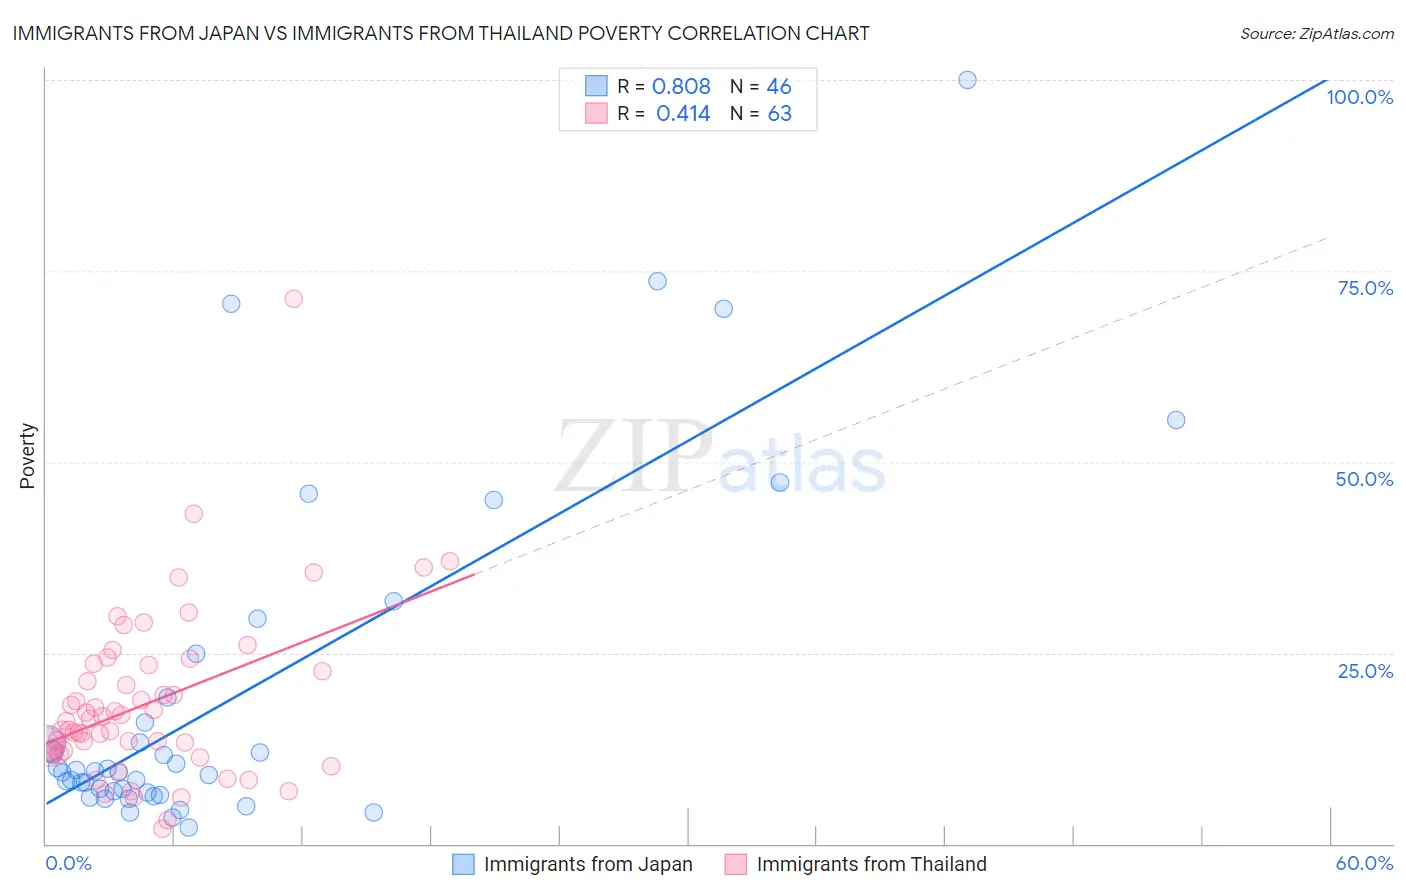
Immigrants from Japan vs Immigrants from Thailand Poverty Correlation Chart
The statistical analysis conducted on geographies consisting of 340,013,080 people shows a very strong positive correlation between the proportion of Immigrants from Japan and poverty level in the United States with a correlation coefficient (R) of 0.808 and weighted average of 11.0%. Similarly, the statistical analysis conducted on geographies consisting of 316,935,515 people shows a moderate positive correlation between the proportion of Immigrants from Thailand and poverty level in the United States with a correlation coefficient (R) of 0.414 and weighted average of 13.3%, a difference of 21.5%.
Poverty Correlation Summary
| Measurement | Immigrants from Japan | Immigrants from Thailand |
| Minimum | 2.0% | 2.0% |
| Maximum | 100.0% | 71.4% |
| Range | 98.0% | 69.4% |
| Mean | 19.4% | 18.3% |
| Median | 9.4% | 16.1% |
| Interquartile 25% (IQ1) | 6.6% | 12.1% |
| Interquartile 75% (IQ3) | 19.2% | 23.4% |
| Interquartile Range (IQR) | 12.6% | 11.4% |
| Standard Deviation (Sample) | 22.6% | 11.1% |
| Standard Deviation (Population) | 22.4% | 11.0% |
Similar Demographics by Poverty
Demographics Similar to Immigrants from Japan by Poverty
In terms of poverty, the demographic groups most similar to Immigrants from Japan are Slovene (11.0%, a difference of 0.010%), Asian (11.0%, a difference of 0.030%), Immigrants from Romania (11.0%, a difference of 0.050%), Immigrants from Czechoslovakia (11.0%, a difference of 0.070%), and Turkish (11.0%, a difference of 0.15%).
| Demographics | Rating | Rank | Poverty |
| Koreans | 99.2 /100 | #42 | Exceptional 10.9% |
| Immigrants | Singapore | 99.2 /100 | #43 | Exceptional 10.9% |
| Immigrants | Moldova | 99.1 /100 | #44 | Exceptional 10.9% |
| Turks | 98.9 /100 | #45 | Exceptional 11.0% |
| Immigrants | Czechoslovakia | 98.9 /100 | #46 | Exceptional 11.0% |
| Immigrants | Romania | 98.9 /100 | #47 | Exceptional 11.0% |
| Slovenes | 98.9 /100 | #48 | Exceptional 11.0% |
| Immigrants | Japan | 98.9 /100 | #49 | Exceptional 11.0% |
| Asians | 98.9 /100 | #50 | Exceptional 11.0% |
| Immigrants | Croatia | 98.7 /100 | #51 | Exceptional 11.0% |
| Immigrants | Philippines | 98.7 /100 | #52 | Exceptional 11.0% |
| Immigrants | Austria | 98.6 /100 | #53 | Exceptional 11.1% |
| Immigrants | Bulgaria | 98.5 /100 | #54 | Exceptional 11.1% |
| Immigrants | Serbia | 98.5 /100 | #55 | Exceptional 11.1% |
| Estonians | 98.2 /100 | #56 | Exceptional 11.1% |
Demographics Similar to Immigrants from Thailand by Poverty
In terms of poverty, the demographic groups most similar to Immigrants from Thailand are Immigrants from Uzbekistan (13.3%, a difference of 0.060%), Japanese (13.3%, a difference of 0.10%), Nonimmigrants (13.3%, a difference of 0.10%), Immigrants from Cambodia (13.4%, a difference of 0.12%), and American (13.4%, a difference of 0.21%).
| Demographics | Rating | Rank | Poverty |
| Moroccans | 5.2 /100 | #211 | Tragic 13.2% |
| Immigrants | Immigrants | 4.3 /100 | #212 | Tragic 13.2% |
| Immigrants | Panama | 4.1 /100 | #213 | Tragic 13.3% |
| Bermudans | 3.7 /100 | #214 | Tragic 13.3% |
| Japanese | 3.3 /100 | #215 | Tragic 13.3% |
| Immigrants | Nonimmigrants | 3.3 /100 | #216 | Tragic 13.3% |
| Immigrants | Uzbekistan | 3.2 /100 | #217 | Tragic 13.3% |
| Immigrants | Thailand | 3.1 /100 | #218 | Tragic 13.3% |
| Immigrants | Cambodia | 3.0 /100 | #219 | Tragic 13.4% |
| Americans | 2.9 /100 | #220 | Tragic 13.4% |
| Alsatians | 2.6 /100 | #221 | Tragic 13.4% |
| Immigrants | Micronesia | 2.6 /100 | #222 | Tragic 13.4% |
| Immigrants | Africa | 2.5 /100 | #223 | Tragic 13.4% |
| Immigrants | Eritrea | 2.4 /100 | #224 | Tragic 13.4% |
| German Russians | 2.2 /100 | #225 | Tragic 13.4% |