Immigrants from Western Asia vs Immigrants from Thailand Poverty
COMPARE
Immigrants from Western Asia
Immigrants from Thailand
Poverty
Poverty Comparison
Immigrants from Western Asia
Immigrants from Thailand
12.9%
POVERTY
14.1/ 100
METRIC RATING
204th/ 347
METRIC RANK
13.3%
POVERTY
3.1/ 100
METRIC RATING
218th/ 347
METRIC RANK
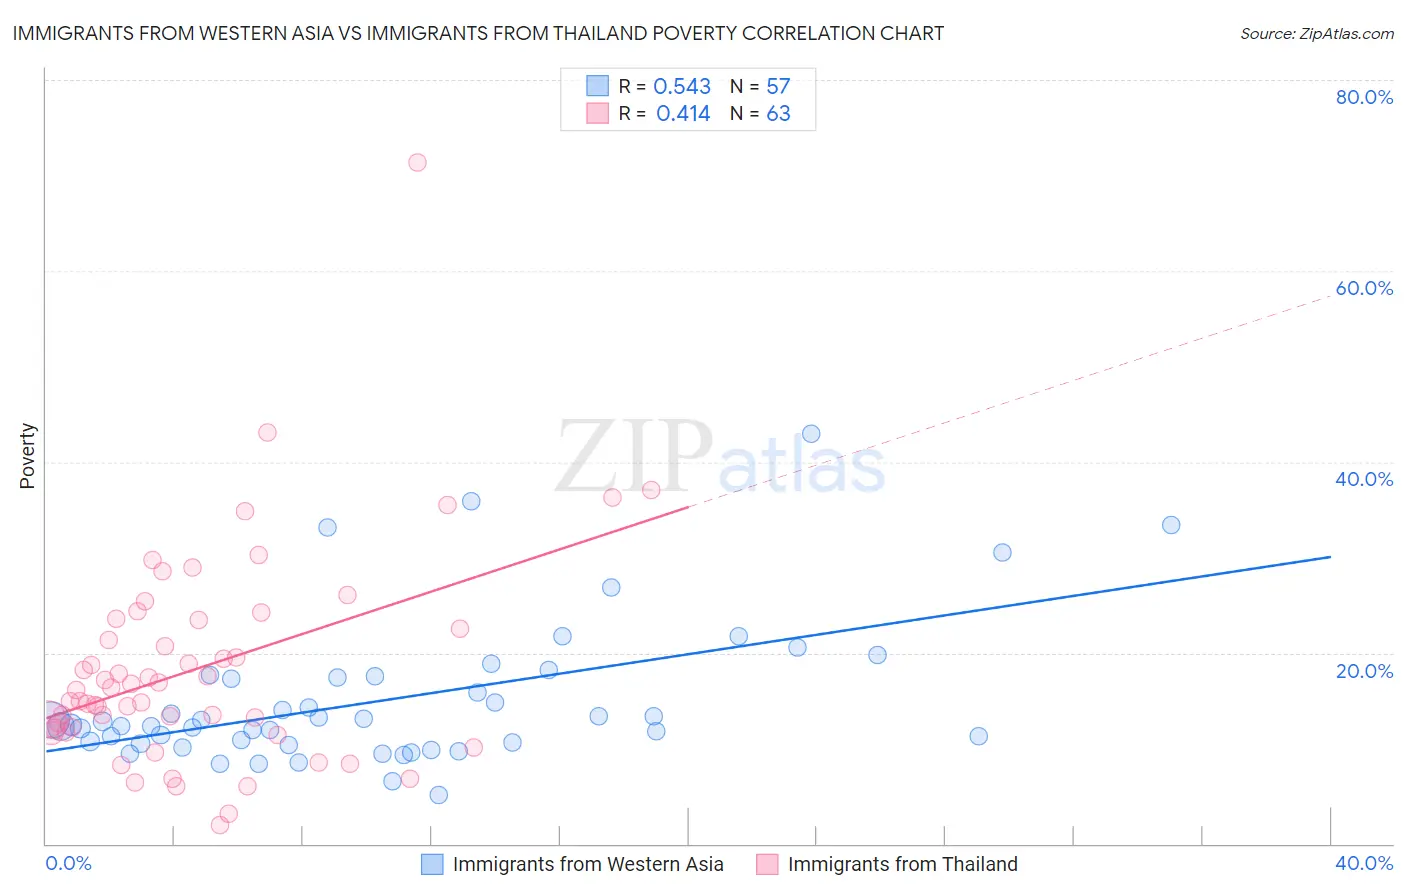
Immigrants from Western Asia vs Immigrants from Thailand Poverty Correlation Chart
The statistical analysis conducted on geographies consisting of 404,214,361 people shows a substantial positive correlation between the proportion of Immigrants from Western Asia and poverty level in the United States with a correlation coefficient (R) of 0.543 and weighted average of 12.9%. Similarly, the statistical analysis conducted on geographies consisting of 316,935,515 people shows a moderate positive correlation between the proportion of Immigrants from Thailand and poverty level in the United States with a correlation coefficient (R) of 0.414 and weighted average of 13.3%, a difference of 3.8%.
Poverty Correlation Summary
| Measurement | Immigrants from Western Asia | Immigrants from Thailand |
| Minimum | 5.2% | 2.0% |
| Maximum | 42.9% | 71.4% |
| Range | 37.7% | 69.4% |
| Mean | 15.1% | 18.3% |
| Median | 12.5% | 16.1% |
| Interquartile 25% (IQ1) | 10.5% | 12.1% |
| Interquartile 75% (IQ3) | 17.5% | 23.4% |
| Interquartile Range (IQR) | 7.0% | 11.4% |
| Standard Deviation (Sample) | 7.6% | 11.1% |
| Standard Deviation (Population) | 7.5% | 11.0% |
Demographics Similar to Immigrants from Western Asia and Immigrants from Thailand by Poverty
In terms of poverty, the demographic groups most similar to Immigrants from Western Asia are Hmong (12.8%, a difference of 0.16%), Immigrants from Uruguay (12.8%, a difference of 0.26%), Immigrants from Uganda (12.8%, a difference of 0.43%), Tsimshian (13.0%, a difference of 1.1%), and Immigrants from Eastern Africa (13.1%, a difference of 1.8%). Similarly, the demographic groups most similar to Immigrants from Thailand are Immigrants from Uzbekistan (13.3%, a difference of 0.060%), Japanese (13.3%, a difference of 0.10%), Nonimmigrants (13.3%, a difference of 0.10%), Immigrants from Cambodia (13.4%, a difference of 0.12%), and American (13.4%, a difference of 0.21%).
| Demographics | Rating | Rank | Poverty |
| Immigrants | Uganda | 16.5 /100 | #201 | Poor 12.8% |
| Immigrants | Uruguay | 15.6 /100 | #202 | Poor 12.8% |
| Hmong | 15.0 /100 | #203 | Poor 12.8% |
| Immigrants | Western Asia | 14.1 /100 | #204 | Poor 12.9% |
| Tsimshian | 9.2 /100 | #205 | Tragic 13.0% |
| Immigrants | Eastern Africa | 7.0 /100 | #206 | Tragic 13.1% |
| Panamanians | 6.6 /100 | #207 | Tragic 13.1% |
| Ugandans | 6.2 /100 | #208 | Tragic 13.1% |
| Malaysians | 6.1 /100 | #209 | Tragic 13.1% |
| Immigrants | Azores | 6.1 /100 | #210 | Tragic 13.1% |
| Moroccans | 5.2 /100 | #211 | Tragic 13.2% |
| Immigrants | Immigrants | 4.3 /100 | #212 | Tragic 13.2% |
| Immigrants | Panama | 4.1 /100 | #213 | Tragic 13.3% |
| Bermudans | 3.7 /100 | #214 | Tragic 13.3% |
| Japanese | 3.3 /100 | #215 | Tragic 13.3% |
| Immigrants | Nonimmigrants | 3.3 /100 | #216 | Tragic 13.3% |
| Immigrants | Uzbekistan | 3.2 /100 | #217 | Tragic 13.3% |
| Immigrants | Thailand | 3.1 /100 | #218 | Tragic 13.3% |
| Immigrants | Cambodia | 3.0 /100 | #219 | Tragic 13.4% |
| Americans | 2.9 /100 | #220 | Tragic 13.4% |
| Alsatians | 2.6 /100 | #221 | Tragic 13.4% |