Immigrants from Sierra Leone vs Immigrants from Jamaica Female Poverty
COMPARE
Immigrants from Sierra Leone
Immigrants from Jamaica
Female Poverty
Female Poverty Comparison
Immigrants from Sierra Leone
Immigrants from Jamaica
13.5%
FEMALE POVERTY
43.2/ 100
METRIC RATING
184th/ 347
METRIC RANK
15.6%
FEMALE POVERTY
0.1/ 100
METRIC RATING
257th/ 347
METRIC RANK
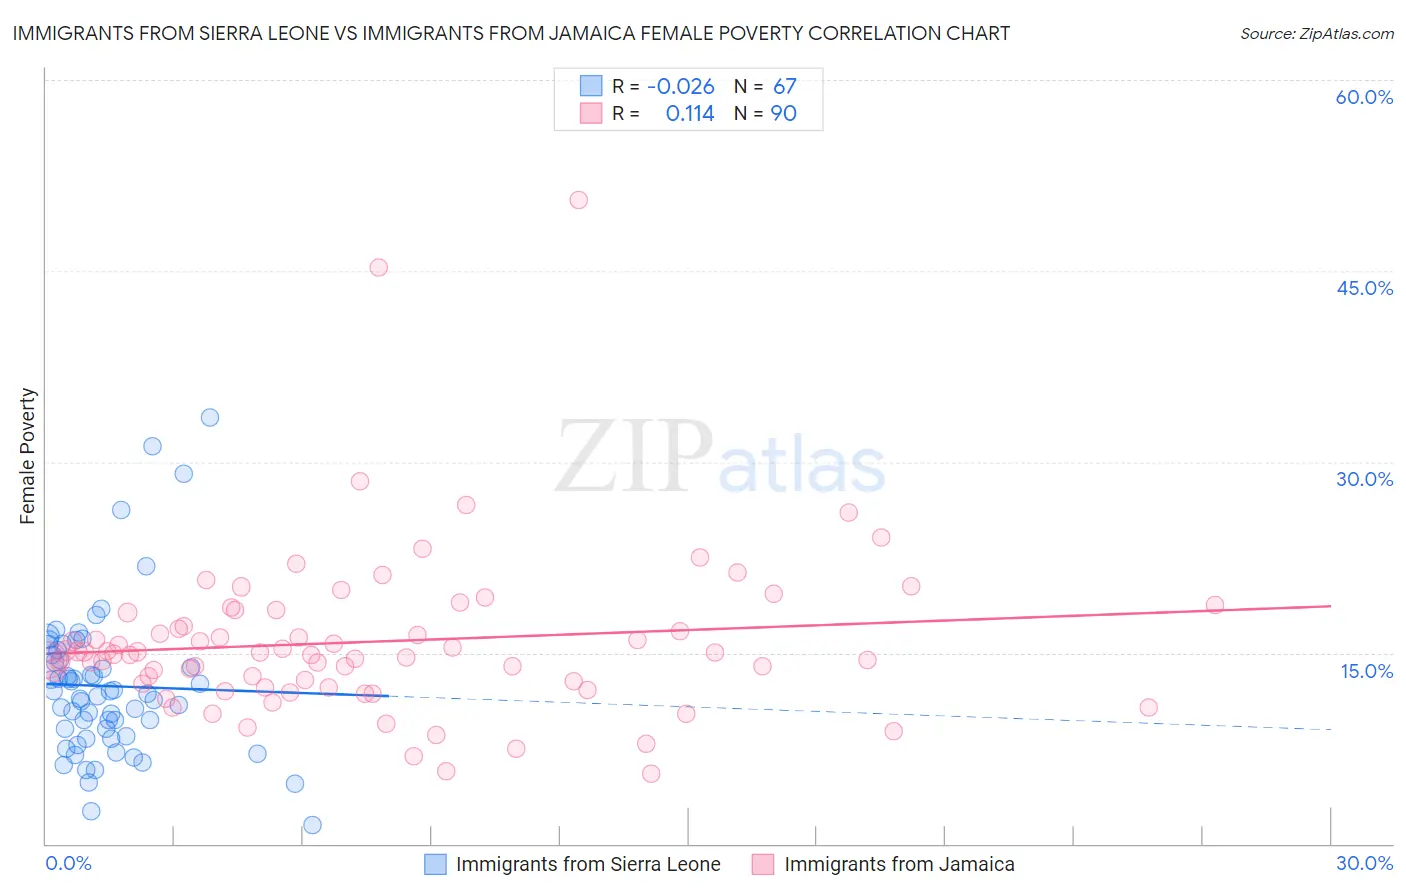
Immigrants from Sierra Leone vs Immigrants from Jamaica Female Poverty Correlation Chart
The statistical analysis conducted on geographies consisting of 101,642,339 people shows no correlation between the proportion of Immigrants from Sierra Leone and poverty level among females in the United States with a correlation coefficient (R) of -0.026 and weighted average of 13.5%. Similarly, the statistical analysis conducted on geographies consisting of 301,557,879 people shows a poor positive correlation between the proportion of Immigrants from Jamaica and poverty level among females in the United States with a correlation coefficient (R) of 0.114 and weighted average of 15.6%, a difference of 14.9%.
Female Poverty Correlation Summary
| Measurement | Immigrants from Sierra Leone | Immigrants from Jamaica |
| Minimum | 1.5% | 5.5% |
| Maximum | 33.5% | 50.6% |
| Range | 32.0% | 45.1% |
| Mean | 12.4% | 15.9% |
| Median | 11.8% | 15.0% |
| Interquartile 25% (IQ1) | 8.4% | 12.6% |
| Interquartile 75% (IQ3) | 14.9% | 18.2% |
| Interquartile Range (IQR) | 6.4% | 5.6% |
| Standard Deviation (Sample) | 6.0% | 6.6% |
| Standard Deviation (Population) | 5.9% | 6.5% |
Similar Demographics by Female Poverty
Demographics Similar to Immigrants from Sierra Leone by Female Poverty
In terms of female poverty, the demographic groups most similar to Immigrants from Sierra Leone are Kenyan (13.5%, a difference of 0.060%), Immigrants from Cameroon (13.5%, a difference of 0.11%), Venezuelan (13.5%, a difference of 0.13%), Immigrants from Colombia (13.5%, a difference of 0.13%), and South American (13.5%, a difference of 0.16%).
| Demographics | Rating | Rank | Female Poverty |
| Immigrants | Morocco | 49.4 /100 | #177 | Average 13.4% |
| Israelis | 49.1 /100 | #178 | Average 13.5% |
| Immigrants | Syria | 48.8 /100 | #179 | Average 13.5% |
| South Americans | 44.8 /100 | #180 | Average 13.5% |
| Venezuelans | 44.5 /100 | #181 | Average 13.5% |
| Immigrants | Colombia | 44.5 /100 | #182 | Average 13.5% |
| Kenyans | 43.8 /100 | #183 | Average 13.5% |
| Immigrants | Sierra Leone | 43.2 /100 | #184 | Average 13.5% |
| Immigrants | Cameroon | 42.0 /100 | #185 | Average 13.5% |
| Immigrants | Portugal | 41.5 /100 | #186 | Average 13.6% |
| Immigrants | Venezuela | 41.0 /100 | #187 | Average 13.6% |
| Hawaiians | 39.9 /100 | #188 | Fair 13.6% |
| Uruguayans | 39.8 /100 | #189 | Fair 13.6% |
| Sierra Leoneans | 33.1 /100 | #190 | Fair 13.7% |
| Immigrants | Kuwait | 32.7 /100 | #191 | Fair 13.7% |
Demographics Similar to Immigrants from Jamaica by Female Poverty
In terms of female poverty, the demographic groups most similar to Immigrants from Jamaica are Shoshone (15.6%, a difference of 0.060%), Jamaican (15.5%, a difference of 0.12%), Cape Verdean (15.6%, a difference of 0.18%), Immigrants from Guyana (15.6%, a difference of 0.25%), and Guyanese (15.6%, a difference of 0.35%).
| Demographics | Rating | Rank | Female Poverty |
| Immigrants | Western Africa | 0.3 /100 | #250 | Tragic 15.3% |
| Immigrants | Trinidad and Tobago | 0.3 /100 | #251 | Tragic 15.4% |
| Immigrants | Burma/Myanmar | 0.3 /100 | #252 | Tragic 15.4% |
| Liberians | 0.2 /100 | #253 | Tragic 15.4% |
| Trinidadians and Tobagonians | 0.2 /100 | #254 | Tragic 15.4% |
| Ottawa | 0.2 /100 | #255 | Tragic 15.5% |
| Jamaicans | 0.2 /100 | #256 | Tragic 15.5% |
| Immigrants | Jamaica | 0.1 /100 | #257 | Tragic 15.6% |
| Shoshone | 0.1 /100 | #258 | Tragic 15.6% |
| Cape Verdeans | 0.1 /100 | #259 | Tragic 15.6% |
| Immigrants | Guyana | 0.1 /100 | #260 | Tragic 15.6% |
| Guyanese | 0.1 /100 | #261 | Tragic 15.6% |
| Mexican American Indians | 0.1 /100 | #262 | Tragic 15.6% |
| Cherokee | 0.1 /100 | #263 | Tragic 15.6% |
| Immigrants | Ecuador | 0.1 /100 | #264 | Tragic 15.6% |