Immigrants from Hungary vs Yakama Female Poverty Among 25-34 Year Olds
COMPARE
Immigrants from Hungary
Yakama
Female Poverty Among 25-34 Year Olds
Female Poverty Among 25-34 Year Olds Comparison
Immigrants from Hungary
Yakama
13.0%
FEMALE POVERTY AMONG 25-34 YEAR OLDS
88.3/ 100
METRIC RATING
132nd/ 347
METRIC RANK
17.6%
FEMALE POVERTY AMONG 25-34 YEAR OLDS
0.0/ 100
METRIC RATING
315th/ 347
METRIC RANK
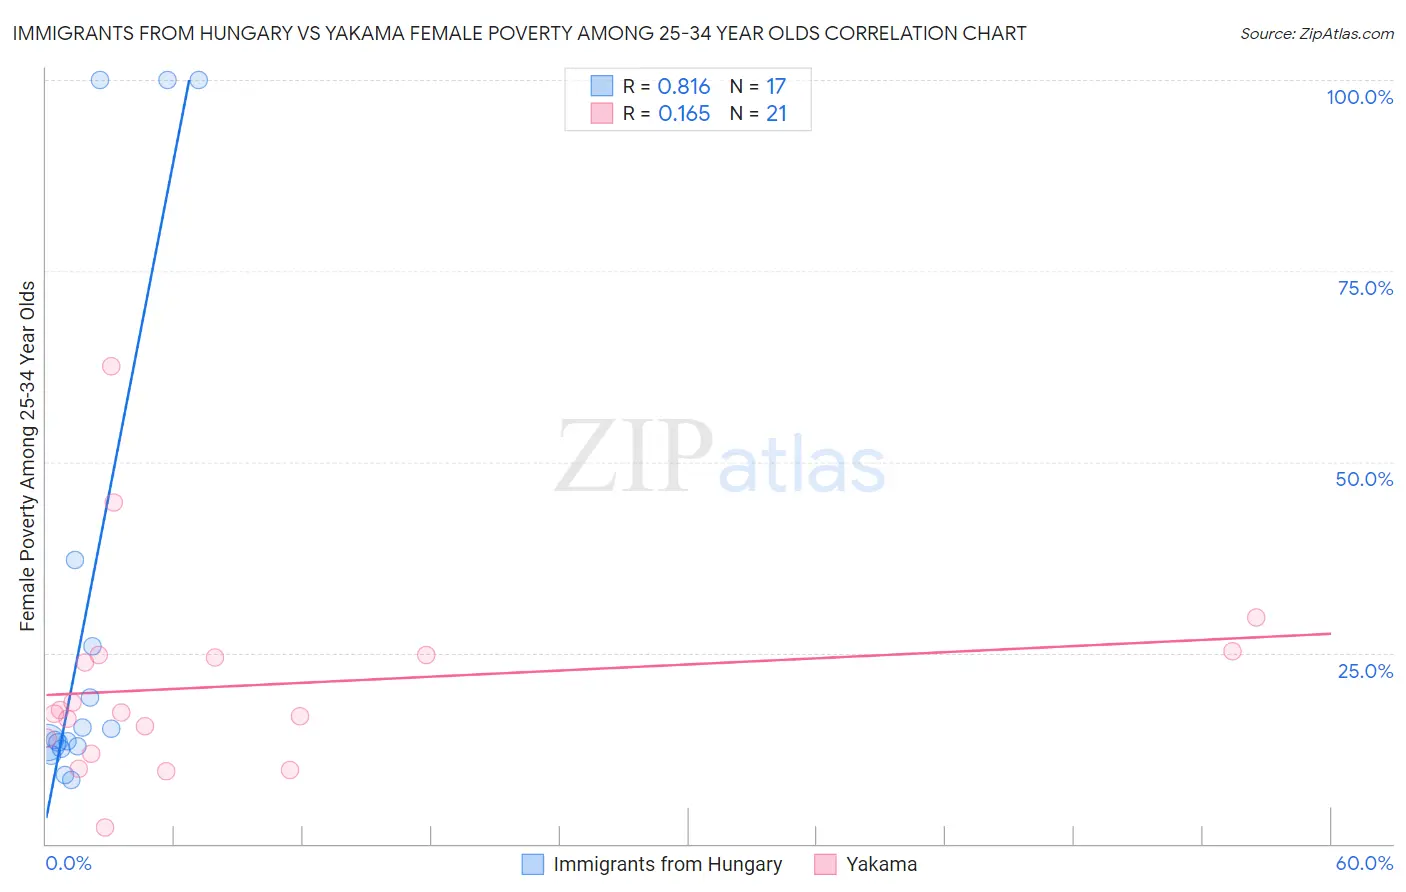
Immigrants from Hungary vs Yakama Female Poverty Among 25-34 Year Olds Correlation Chart
The statistical analysis conducted on geographies consisting of 193,664,103 people shows a very strong positive correlation between the proportion of Immigrants from Hungary and poverty level among females between the ages 25 and 34 in the United States with a correlation coefficient (R) of 0.816 and weighted average of 13.0%. Similarly, the statistical analysis conducted on geographies consisting of 19,834,857 people shows a poor positive correlation between the proportion of Yakama and poverty level among females between the ages 25 and 34 in the United States with a correlation coefficient (R) of 0.165 and weighted average of 17.6%, a difference of 36.0%.
Female Poverty Among 25-34 Year Olds Correlation Summary
| Measurement | Immigrants from Hungary | Yakama |
| Minimum | 8.4% | 2.1% |
| Maximum | 100.0% | 62.5% |
| Range | 91.6% | 60.4% |
| Mean | 30.6% | 20.7% |
| Median | 13.6% | 17.2% |
| Interquartile 25% (IQ1) | 12.6% | 12.8% |
| Interquartile 75% (IQ3) | 31.5% | 24.7% |
| Interquartile Range (IQR) | 18.9% | 12.0% |
| Standard Deviation (Sample) | 33.8% | 13.1% |
| Standard Deviation (Population) | 32.8% | 12.8% |
Similar Demographics by Female Poverty Among 25-34 Year Olds
Demographics Similar to Immigrants from Hungary by Female Poverty Among 25-34 Year Olds
In terms of female poverty among 25-34 year olds, the demographic groups most similar to Immigrants from Hungary are Pakistani (13.0%, a difference of 0.020%), Serbian (13.0%, a difference of 0.14%), Immigrants from Uzbekistan (12.9%, a difference of 0.29%), Immigrants from North America (12.9%, a difference of 0.32%), and Syrian (12.9%, a difference of 0.43%).
| Demographics | Rating | Rank | Female Poverty Among 25-34 Year Olds |
| Immigrants | Canada | 91.5 /100 | #125 | Exceptional 12.9% |
| Immigrants | Fiji | 91.2 /100 | #126 | Exceptional 12.9% |
| Czechs | 90.3 /100 | #127 | Exceptional 12.9% |
| Syrians | 90.2 /100 | #128 | Exceptional 12.9% |
| Immigrants | North America | 89.7 /100 | #129 | Excellent 12.9% |
| Immigrants | Uzbekistan | 89.6 /100 | #130 | Excellent 12.9% |
| Pakistanis | 88.4 /100 | #131 | Excellent 13.0% |
| Immigrants | Hungary | 88.3 /100 | #132 | Excellent 13.0% |
| Serbians | 87.6 /100 | #133 | Excellent 13.0% |
| Afghans | 85.8 /100 | #134 | Excellent 13.0% |
| South Africans | 85.7 /100 | #135 | Excellent 13.0% |
| Immigrants | England | 85.5 /100 | #136 | Excellent 13.0% |
| Immigrants | Chile | 84.6 /100 | #137 | Excellent 13.1% |
| Brazilians | 84.5 /100 | #138 | Excellent 13.1% |
| Austrians | 83.7 /100 | #139 | Excellent 13.1% |
Demographics Similar to Yakama by Female Poverty Among 25-34 Year Olds
In terms of female poverty among 25-34 year olds, the demographic groups most similar to Yakama are Dominican (17.6%, a difference of 0.0%), Immigrants from Dominican Republic (17.6%, a difference of 0.22%), Arapaho (17.8%, a difference of 0.79%), Colville (17.5%, a difference of 0.90%), and Iroquois (17.5%, a difference of 0.98%).
| Demographics | Rating | Rank | Female Poverty Among 25-34 Year Olds |
| Africans | 0.0 /100 | #308 | Tragic 17.0% |
| Ottawa | 0.0 /100 | #309 | Tragic 17.1% |
| Cherokee | 0.0 /100 | #310 | Tragic 17.2% |
| Immigrants | Honduras | 0.0 /100 | #311 | Tragic 17.3% |
| Iroquois | 0.0 /100 | #312 | Tragic 17.5% |
| Colville | 0.0 /100 | #313 | Tragic 17.5% |
| Immigrants | Dominican Republic | 0.0 /100 | #314 | Tragic 17.6% |
| Yakama | 0.0 /100 | #315 | Tragic 17.6% |
| Dominicans | 0.0 /100 | #316 | Tragic 17.6% |
| Arapaho | 0.0 /100 | #317 | Tragic 17.8% |
| Ute | 0.0 /100 | #318 | Tragic 17.9% |
| Menominee | 0.0 /100 | #319 | Tragic 18.0% |
| Chippewa | 0.0 /100 | #320 | Tragic 18.0% |
| Choctaw | 0.0 /100 | #321 | Tragic 18.1% |
| Central American Indians | 0.0 /100 | #322 | Tragic 18.2% |