Immigrants from Hungary vs Immigrants from Albania Female Poverty Among 25-34 Year Olds
COMPARE
Immigrants from Hungary
Immigrants from Albania
Female Poverty Among 25-34 Year Olds
Female Poverty Among 25-34 Year Olds Comparison
Immigrants from Hungary
Immigrants from Albania
13.0%
FEMALE POVERTY AMONG 25-34 YEAR OLDS
88.3/ 100
METRIC RATING
132nd/ 347
METRIC RANK
12.5%
FEMALE POVERTY AMONG 25-34 YEAR OLDS
97.1/ 100
METRIC RATING
90th/ 347
METRIC RANK
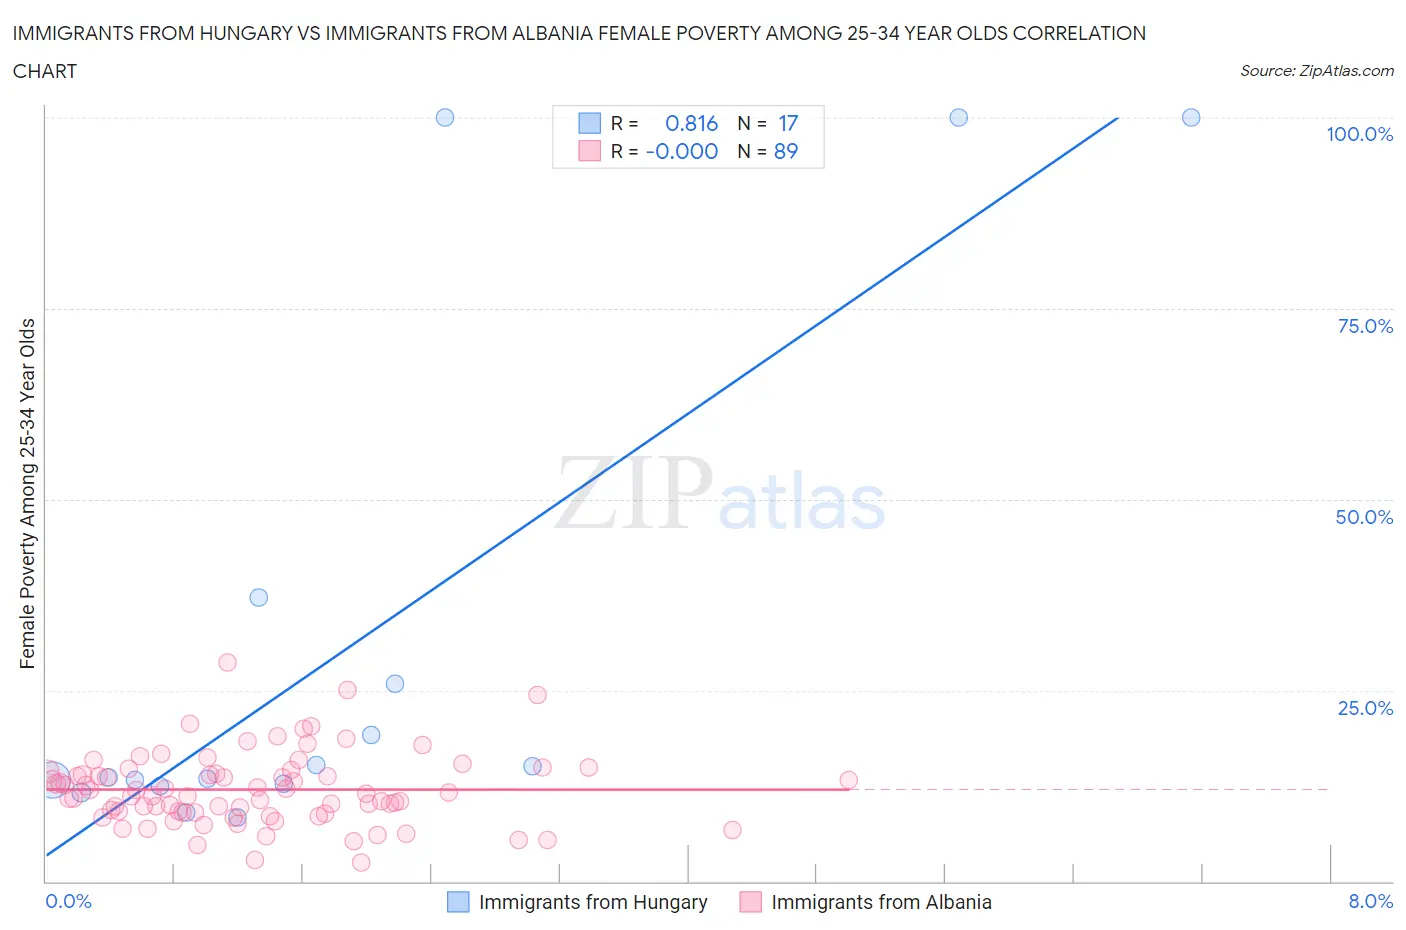
Immigrants from Hungary vs Immigrants from Albania Female Poverty Among 25-34 Year Olds Correlation Chart
The statistical analysis conducted on geographies consisting of 193,664,103 people shows a very strong positive correlation between the proportion of Immigrants from Hungary and poverty level among females between the ages 25 and 34 in the United States with a correlation coefficient (R) of 0.816 and weighted average of 13.0%. Similarly, the statistical analysis conducted on geographies consisting of 118,599,932 people shows no correlation between the proportion of Immigrants from Albania and poverty level among females between the ages 25 and 34 in the United States with a correlation coefficient (R) of -0.000 and weighted average of 12.5%, a difference of 3.3%.
Female Poverty Among 25-34 Year Olds Correlation Summary
| Measurement | Immigrants from Hungary | Immigrants from Albania |
| Minimum | 8.4% | 2.5% |
| Maximum | 100.0% | 28.6% |
| Range | 91.6% | 26.1% |
| Mean | 30.6% | 12.0% |
| Median | 13.6% | 11.4% |
| Interquartile 25% (IQ1) | 12.6% | 9.0% |
| Interquartile 75% (IQ3) | 31.5% | 14.2% |
| Interquartile Range (IQR) | 18.9% | 5.2% |
| Standard Deviation (Sample) | 33.8% | 4.7% |
| Standard Deviation (Population) | 32.8% | 4.7% |
Similar Demographics by Female Poverty Among 25-34 Year Olds
Demographics Similar to Immigrants from Hungary by Female Poverty Among 25-34 Year Olds
In terms of female poverty among 25-34 year olds, the demographic groups most similar to Immigrants from Hungary are Pakistani (13.0%, a difference of 0.020%), Serbian (13.0%, a difference of 0.14%), Immigrants from Uzbekistan (12.9%, a difference of 0.29%), Immigrants from North America (12.9%, a difference of 0.32%), and Syrian (12.9%, a difference of 0.43%).
| Demographics | Rating | Rank | Female Poverty Among 25-34 Year Olds |
| Immigrants | Canada | 91.5 /100 | #125 | Exceptional 12.9% |
| Immigrants | Fiji | 91.2 /100 | #126 | Exceptional 12.9% |
| Czechs | 90.3 /100 | #127 | Exceptional 12.9% |
| Syrians | 90.2 /100 | #128 | Exceptional 12.9% |
| Immigrants | North America | 89.7 /100 | #129 | Excellent 12.9% |
| Immigrants | Uzbekistan | 89.6 /100 | #130 | Excellent 12.9% |
| Pakistanis | 88.4 /100 | #131 | Excellent 13.0% |
| Immigrants | Hungary | 88.3 /100 | #132 | Excellent 13.0% |
| Serbians | 87.6 /100 | #133 | Excellent 13.0% |
| Afghans | 85.8 /100 | #134 | Excellent 13.0% |
| South Africans | 85.7 /100 | #135 | Excellent 13.0% |
| Immigrants | England | 85.5 /100 | #136 | Excellent 13.0% |
| Immigrants | Chile | 84.6 /100 | #137 | Excellent 13.1% |
| Brazilians | 84.5 /100 | #138 | Excellent 13.1% |
| Austrians | 83.7 /100 | #139 | Excellent 13.1% |
Demographics Similar to Immigrants from Albania by Female Poverty Among 25-34 Year Olds
In terms of female poverty among 25-34 year olds, the demographic groups most similar to Immigrants from Albania are Norwegian (12.6%, a difference of 0.10%), Immigrants from Armenia (12.6%, a difference of 0.11%), Palestinian (12.6%, a difference of 0.14%), Italian (12.5%, a difference of 0.15%), and Immigrants from France (12.6%, a difference of 0.20%).
| Demographics | Rating | Rank | Female Poverty Among 25-34 Year Olds |
| Albanians | 97.7 /100 | #83 | Exceptional 12.5% |
| Immigrants | Latvia | 97.7 /100 | #84 | Exceptional 12.5% |
| Immigrants | South Eastern Asia | 97.6 /100 | #85 | Exceptional 12.5% |
| Croatians | 97.5 /100 | #86 | Exceptional 12.5% |
| Argentineans | 97.5 /100 | #87 | Exceptional 12.5% |
| Immigrants | Austria | 97.4 /100 | #88 | Exceptional 12.5% |
| Italians | 97.2 /100 | #89 | Exceptional 12.5% |
| Immigrants | Albania | 97.1 /100 | #90 | Exceptional 12.5% |
| Norwegians | 96.9 /100 | #91 | Exceptional 12.6% |
| Immigrants | Armenia | 96.9 /100 | #92 | Exceptional 12.6% |
| Palestinians | 96.9 /100 | #93 | Exceptional 12.6% |
| Immigrants | France | 96.8 /100 | #94 | Exceptional 12.6% |
| Ukrainians | 96.7 /100 | #95 | Exceptional 12.6% |
| Immigrants | Zimbabwe | 96.7 /100 | #96 | Exceptional 12.6% |
| Immigrants | Northern Africa | 96.6 /100 | #97 | Exceptional 12.6% |