Immigrants from Hungary vs Navajo Seniors Poverty Over the Age of 75
COMPARE
Immigrants from Hungary
Navajo
Seniors Poverty Over the Age of 75
Seniors Poverty Over the Age of 75 Comparison
Immigrants from Hungary
Navajo
11.8%
SENIORS POVERTY OVER THE AGE OF 75
81.7/ 100
METRIC RATING
128th/ 347
METRIC RANK
19.4%
SENIORS POVERTY OVER THE AGE OF 75
0.0/ 100
METRIC RATING
341st/ 347
METRIC RANK
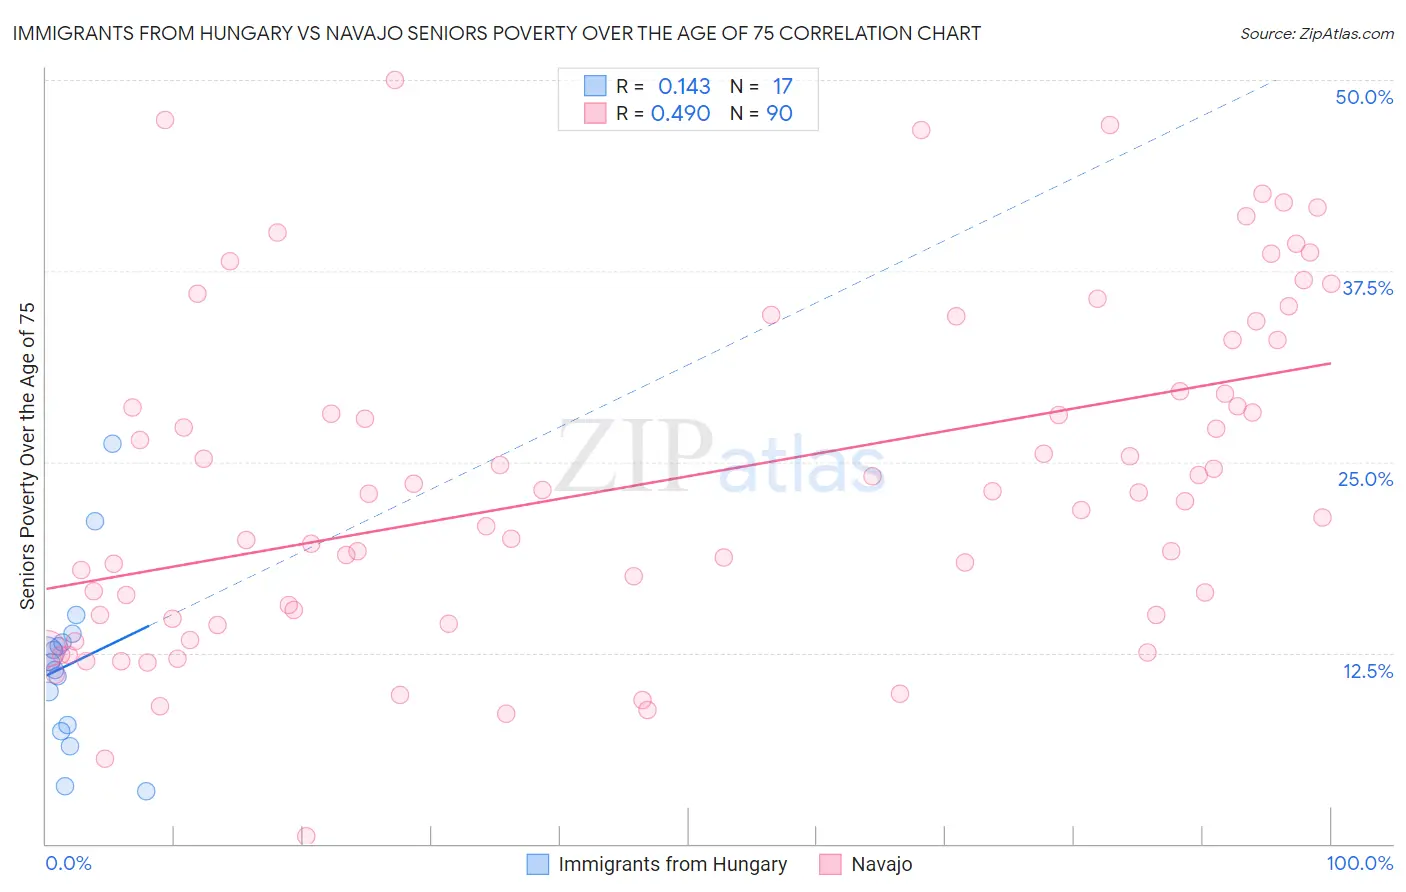
Immigrants from Hungary vs Navajo Seniors Poverty Over the Age of 75 Correlation Chart
The statistical analysis conducted on geographies consisting of 194,738,636 people shows a poor positive correlation between the proportion of Immigrants from Hungary and poverty level among seniors over the age of 75 in the United States with a correlation coefficient (R) of 0.143 and weighted average of 11.8%. Similarly, the statistical analysis conducted on geographies consisting of 222,735,587 people shows a moderate positive correlation between the proportion of Navajo and poverty level among seniors over the age of 75 in the United States with a correlation coefficient (R) of 0.490 and weighted average of 19.4%, a difference of 64.0%.
Seniors Poverty Over the Age of 75 Correlation Summary
| Measurement | Immigrants from Hungary | Navajo |
| Minimum | 3.5% | 0.49% |
| Maximum | 26.2% | 50.0% |
| Range | 22.7% | 49.5% |
| Mean | 11.8% | 23.8% |
| Median | 11.8% | 22.9% |
| Interquartile 25% (IQ1) | 7.6% | 15.0% |
| Interquartile 75% (IQ3) | 13.5% | 32.9% |
| Interquartile Range (IQR) | 5.9% | 18.0% |
| Standard Deviation (Sample) | 5.7% | 11.1% |
| Standard Deviation (Population) | 5.5% | 11.0% |
Similar Demographics by Seniors Poverty Over the Age of 75
Demographics Similar to Immigrants from Hungary by Seniors Poverty Over the Age of 75
In terms of seniors poverty over the age of 75, the demographic groups most similar to Immigrants from Hungary are Immigrants from Denmark (11.8%, a difference of 0.12%), Ethiopian (11.8%, a difference of 0.15%), Spanish (11.8%, a difference of 0.17%), Pennsylvania German (11.8%, a difference of 0.24%), and Sudanese (11.8%, a difference of 0.28%).
| Demographics | Rating | Rank | Seniors Poverty Over the Age of 75 |
| Malaysians | 84.1 /100 | #121 | Excellent 11.8% |
| Pakistanis | 84.0 /100 | #122 | Excellent 11.8% |
| Immigrants | Italy | 84.0 /100 | #123 | Excellent 11.8% |
| Fijians | 83.8 /100 | #124 | Excellent 11.8% |
| Sudanese | 83.6 /100 | #125 | Excellent 11.8% |
| Pennsylvania Germans | 83.4 /100 | #126 | Excellent 11.8% |
| Immigrants | Denmark | 82.6 /100 | #127 | Excellent 11.8% |
| Immigrants | Hungary | 81.7 /100 | #128 | Excellent 11.8% |
| Ethiopians | 80.7 /100 | #129 | Excellent 11.8% |
| Spanish | 80.5 /100 | #130 | Excellent 11.8% |
| Immigrants | Western Europe | 79.6 /100 | #131 | Good 11.9% |
| Lebanese | 78.3 /100 | #132 | Good 11.9% |
| Immigrants | Sierra Leone | 77.6 /100 | #133 | Good 11.9% |
| Ugandans | 77.1 /100 | #134 | Good 11.9% |
| Immigrants | Ireland | 76.2 /100 | #135 | Good 11.9% |
Demographics Similar to Navajo by Seniors Poverty Over the Age of 75
In terms of seniors poverty over the age of 75, the demographic groups most similar to Navajo are Dominican (19.6%, a difference of 1.2%), Tohono O'odham (19.1%, a difference of 1.3%), Lumbee (19.7%, a difference of 1.9%), Immigrants from Cuba (19.9%, a difference of 2.7%), and Hopi (18.9%, a difference of 2.8%).
| Demographics | Rating | Rank | Seniors Poverty Over the Age of 75 |
| Immigrants | Nicaragua | 0.0 /100 | #333 | Tragic 17.6% |
| Immigrants | Grenada | 0.0 /100 | #334 | Tragic 17.8% |
| Cubans | 0.0 /100 | #335 | Tragic 18.0% |
| Immigrants | Caribbean | 0.0 /100 | #336 | Tragic 18.2% |
| Yakama | 0.0 /100 | #337 | Tragic 18.3% |
| Immigrants | Cabo Verde | 0.0 /100 | #338 | Tragic 18.5% |
| Hopi | 0.0 /100 | #339 | Tragic 18.9% |
| Tohono O'odham | 0.0 /100 | #340 | Tragic 19.1% |
| Navajo | 0.0 /100 | #341 | Tragic 19.4% |
| Dominicans | 0.0 /100 | #342 | Tragic 19.6% |
| Lumbee | 0.0 /100 | #343 | Tragic 19.7% |
| Immigrants | Cuba | 0.0 /100 | #344 | Tragic 19.9% |
| Immigrants | Dominican Republic | 0.0 /100 | #345 | Tragic 20.1% |
| Puerto Ricans | 0.0 /100 | #346 | Tragic 23.2% |
| Pima | 0.0 /100 | #347 | Tragic 23.9% |