Immigrants from Hungary vs Immigrants from Guatemala Seniors Poverty Over the Age of 75

COMPARE

Immigrants from Hungary
Race
Ancestry
AfghanAfricanAlaska NativeAlaskan AthabascanAlbanianAleutAlsatianAmericanApacheArabArapahoArgentineanArmenianAssyrian/Chaldean/SyriacAustralianAustrianBahamianBangladeshiBarbadianBasqueBelgianBelizeanBermudanBhutaneseBlackfeetBolivianBrazilianBritishBritish West IndianBulgarianBurmeseCajunCambodianCanadianCape VerdeanCarpatho RusynCelticCentral AmericanCentral American IndianCherokeeCheyenneChickasawChileanChineseChippewaChoctawColombianColvilleComancheCosta RicanCreeCreekCroatianCrowCubanCypriotCzechCzechoslovakianDanishDelawareDominicanDutchDutch West IndianEastern EuropeanEcuadorianEgyptianEnglishEstonianEthiopianEuropeanFijianFilipinoFinnishFrenchFrench American IndianFrench CanadianGermanGerman RussianGhanaianGreekGuamanian/ChamorroGuatemalanGuyaneseHaitianHmongHonduranHopiHoumaHungarianIcelanderIndian (Asian)IndonesianInupiatIranianIraqiIrishIroquoisIsraeliItalianJamaicanJapaneseJordanianKenyanKiowaKoreanLaotianLatvianLebaneseLiberianLithuanianLumbeeLuxembourgerMacedonianMalaysianMalteseMarshalleseMenomineeMexicanMexican American IndianMongolianMoroccanNative HawaiianNavajoNepaleseNew ZealanderNicaraguanNigerianNorthern EuropeanNorwegianOkinawanOsageOttawaPaiutePakistaniPalestinianPanamanianParaguayanPennsylvania GermanPeruvianPimaPolishPortuguesePotawatomiPuebloPuerto RicanPuget Sound SalishRomanianRussianSalvadoranSamoanScandinavianScotch-IrishScottishSeminoleSenegaleseSerbianShoshoneSierra LeoneanSiouxSlavicSlovakSloveneSomaliSouth AfricanSouth AmericanSouth American IndianSoviet UnionSpaniardSpanishSpanish AmericanSpanish American IndianSri LankanSubsaharan AfricanSudaneseSwedishSwissSyrianTaiwaneseThaiTlingit-HaidaTohono O'OdhamTonganTrinidadian and TobagonianTsimshianTurkishU.S. Virgin IslanderUgandanUkrainianUruguayanUteVenezuelanVietnameseWelshWest IndianYakamaYaquiYugoslavianYumanYup'ikZimbabwean
Immigration
NonimmigrantsImmigrantsAfghanistanAfricaAlbaniaArgentinaArmeniaAsiaAustraliaAustriaBahamasBangladeshBarbadosBelarusBelgiumBelizeBoliviaBosnia and HerzegovinaBrazilBulgariaBurma/MyanmarCabo VerdeCambodiaCameroonCanadaCaribbeanCentral AmericaChileChinaColombiaCongoCosta RicaCroatiaCubaCzechoslovakiaDenmarkDominicaDominican RepublicEastern AfricaEastern AsiaEastern EuropeEcuadorEgyptEl SalvadorEnglandEritreaEthiopiaEuropeFijiFranceGermanyGhanaGreeceGrenadaGuyanaHaitiHondurasHong KongHungaryIndiaIndonesiaIranIraqIrelandIsraelItalyJamaicaJapanJordanKazakhstanKenyaKoreaKuwaitLaosLatin AmericaLatviaLebanonLiberiaLithuaniaMalaysiaMexicoMicronesiaMiddle AfricaMoldovaMoroccoNepalNetherlandsNicaraguaNigeriaNorth AmericaNorth MacedoniaNorthern AfricaNorthern EuropeNorwayOceaniaPakistanPanamaPeruPhilippinesPolandPortugalRomaniaRussiaSaudi ArabiaScotlandSenegalSerbiaSierra LeoneSingaporeSomaliaSouth AfricaSouth AmericaSouth Central AsiaSouth Eastern AsiaSouthern EuropeSpainSri LankaSt. Vincent and the GrenadinesSudanSwedenSwitzerlandSyriaTaiwanThailandTrinidad and TobagoTurkeyUgandaUkraineUruguayUzbekistanVenezuelaVietnamWest IndiesWestern AfricaWestern AsiaWestern EuropeYemenZaireZimbabweAzores
Immigrants from Guatemala
Race
Ancestry
AfghanAfricanAlaska NativeAlaskan AthabascanAlbanianAleutAlsatianAmericanApacheArabArapahoArgentineanArmenianAssyrian/Chaldean/SyriacAustralianAustrianBahamianBangladeshiBarbadianBasqueBelgianBelizeanBermudanBhutaneseBlackfeetBolivianBrazilianBritishBritish West IndianBulgarianBurmeseCajunCambodianCanadianCape VerdeanCarpatho RusynCelticCentral AmericanCentral American IndianCherokeeCheyenneChickasawChileanChineseChippewaChoctawColombianColvilleComancheCosta RicanCreeCreekCroatianCrowCubanCypriotCzechCzechoslovakianDanishDelawareDominicanDutchDutch West IndianEastern EuropeanEcuadorianEgyptianEnglishEstonianEthiopianEuropeanFijianFilipinoFinnishFrenchFrench American IndianFrench CanadianGermanGerman RussianGhanaianGreekGuamanian/ChamorroGuatemalanGuyaneseHaitianHmongHonduranHopiHoumaHungarianIcelanderIndian (Asian)IndonesianInupiatIranianIraqiIrishIroquoisIsraeliItalianJamaicanJapaneseJordanianKenyanKiowaKoreanLaotianLatvianLebaneseLiberianLithuanianLumbeeLuxembourgerMacedonianMalaysianMalteseMarshalleseMenomineeMexicanMexican American IndianMongolianMoroccanNative HawaiianNavajoNepaleseNew ZealanderNicaraguanNigerianNorthern EuropeanNorwegianOkinawanOsageOttawaPaiutePakistaniPalestinianPanamanianParaguayanPennsylvania GermanPeruvianPimaPolishPortuguesePotawatomiPuebloPuerto RicanPuget Sound SalishRomanianRussianSalvadoranSamoanScandinavianScotch-IrishScottishSeminoleSenegaleseSerbianShoshoneSierra LeoneanSiouxSlavicSlovakSloveneSomaliSouth AfricanSouth AmericanSouth American IndianSoviet UnionSpaniardSpanishSpanish AmericanSpanish American IndianSri LankanSubsaharan AfricanSudaneseSwedishSwissSyrianTaiwaneseThaiTlingit-HaidaTohono O'OdhamTonganTrinidadian and TobagonianTsimshianTurkishU.S. Virgin IslanderUgandanUkrainianUruguayanUteVenezuelanVietnameseWelshWest IndianYakamaYaquiYugoslavianYumanYup'ikZimbabwean
Immigration
NonimmigrantsImmigrantsAfghanistanAfricaAlbaniaArgentinaArmeniaAsiaAustraliaAustriaBahamasBangladeshBarbadosBelarusBelgiumBelizeBoliviaBosnia and HerzegovinaBrazilBulgariaBurma/MyanmarCabo VerdeCambodiaCameroonCanadaCaribbeanCentral AmericaChileChinaColombiaCongoCosta RicaCroatiaCubaCzechoslovakiaDenmarkDominicaDominican RepublicEastern AfricaEastern AsiaEastern EuropeEcuadorEgyptEl SalvadorEnglandEritreaEthiopiaEuropeFijiFranceGermanyGhanaGreeceGrenadaGuatemalaGuyanaHaitiHondurasHong KongIndiaIndonesiaIranIraqIrelandIsraelItalyJamaicaJapanJordanKazakhstanKenyaKoreaKuwaitLaosLatin AmericaLatviaLebanonLiberiaLithuaniaMalaysiaMexicoMicronesiaMiddle AfricaMoldovaMoroccoNepalNetherlandsNicaraguaNigeriaNorth AmericaNorth MacedoniaNorthern AfricaNorthern EuropeNorwayOceaniaPakistanPanamaPeruPhilippinesPolandPortugalRomaniaRussiaSaudi ArabiaScotlandSenegalSerbiaSierra LeoneSingaporeSomaliaSouth AfricaSouth AmericaSouth Central AsiaSouth Eastern AsiaSouthern EuropeSpainSri LankaSt. Vincent and the GrenadinesSudanSwedenSwitzerlandSyriaTaiwanThailandTrinidad and TobagoTurkeyUgandaUkraineUruguayUzbekistanVenezuelaVietnamWest IndiesWestern AfricaWestern AsiaWestern EuropeYemenZaireZimbabweAzores
Seniors Poverty Over the Age of 75
Income
Poverty
Unemployment
Labor Participation
Family Structure
Vehicle Availability
Education Level
Disability

Seniors Poverty Over the Age of 75 Comparison

Immigrants from Hungary

Immigrants from Guatemala

Excellent
Tragic
11.8%
SENIORS POVERTY OVER THE AGE OF 75
81.7/ 100
METRIC RATING
128th/ 347
METRIC RANK
15.1%
SENIORS POVERTY OVER THE AGE OF 75
0.0/ 100
METRIC RATING
287th/ 347
METRIC RANK

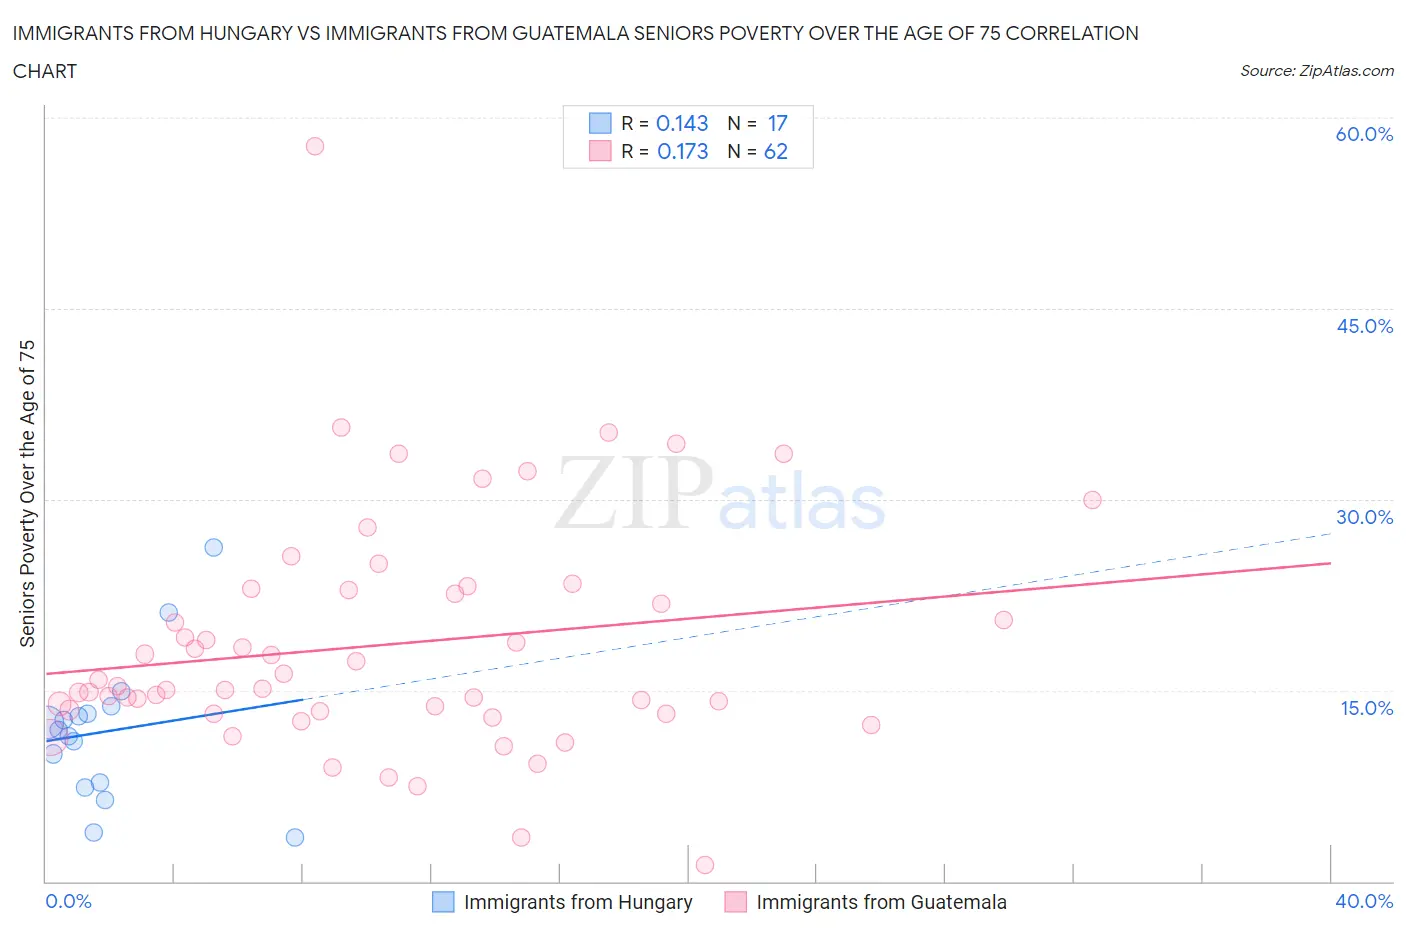
Immigrants from Hungary vs Immigrants from Guatemala Seniors Poverty Over the Age of 75 Correlation Chart

The statistical analysis conducted on geographies consisting of 194,738,636 people shows a poor positive correlation between the proportion of Immigrants from Hungary and poverty level among seniors over the age of 75 in the United States with a correlation coefficient (R) of 0.143 and weighted average of 11.8%. Similarly, the statistical analysis conducted on geographies consisting of 373,963,984 people shows a poor positive correlation between the proportion of Immigrants from Guatemala and poverty level among seniors over the age of 75 in the United States with a correlation coefficient (R) of 0.173 and weighted average of 15.1%, a difference of 27.4%.
Immigrants from Hungary vs Immigrants from Guatemala Seniors Poverty Over the Age of 75

Seniors Poverty Over the Age of 75 Correlation Summary

MeasurementImmigrants from HungaryImmigrants from Guatemala
Minimum3.5%1.2%
Maximum26.2%57.8%
Range22.7%56.5%
Mean11.8%18.6%
Median11.8%15.2%
Interquartile 25% (IQ1)7.6%13.4%
Interquartile 75% (IQ3)13.5%22.9%
Interquartile Range (IQR)5.9%9.5%
Standard Deviation (Sample)5.7%9.3%
Standard Deviation (Population)5.5%9.2%

Similar Demographics by Seniors Poverty Over the Age of 75

Demographics Similar to Immigrants from Hungary by Seniors Poverty Over the Age of 75

In terms of seniors poverty over the age of 75, the demographic groups most similar to Immigrants from Hungary are Immigrants from Denmark (11.8%, a difference of 0.12%), Ethiopian (11.8%, a difference of 0.15%), Spanish (11.8%, a difference of 0.17%), Pennsylvania German (11.8%, a difference of 0.24%), and Sudanese (11.8%, a difference of 0.28%).
DemographicsRating | RankSeniors Poverty Over the Age of 75
Malaysians
84.1
/100
|
#121
Excellent
11.8%
Pakistanis
84.0
/100
|
#122
Excellent
11.8%
Immigrants | Italy
84.0
/100
|
#123
Excellent
11.8%
Fijians
83.8
/100
|
#124
Excellent
11.8%
Sudanese
83.6
/100
|
#125
Excellent
11.8%
Pennsylvania Germans
83.4
/100
|
#126
Excellent
11.8%
Immigrants | Denmark
82.6
/100
|
#127
Excellent
11.8%
Immigrants | Hungary
81.7
/100
|
#128
Excellent
11.8%
Ethiopians
80.7
/100
|
#129
Excellent
11.8%
Spanish
80.5
/100
|
#130
Excellent
11.8%
Immigrants | Western Europe
79.6
/100
|
#131
Good
11.9%
Lebanese
78.3
/100
|
#132
Good
11.9%
Immigrants | Sierra Leone
77.6
/100
|
#133
Good
11.9%
Ugandans
77.1
/100
|
#134
Good
11.9%
Immigrants | Ireland
76.2
/100
|
#135
Good
11.9%

Demographics Similar to Immigrants from Guatemala by Seniors Poverty Over the Age of 75

In terms of seniors poverty over the age of 75, the demographic groups most similar to Immigrants from Guatemala are Immigrants from Central America (15.0%, a difference of 0.59%), Jamaican (15.1%, a difference of 0.60%), Immigrants from Belize (15.2%, a difference of 0.86%), Immigrants from the Azores (15.2%, a difference of 0.88%), and Paiute (15.2%, a difference of 0.89%).
DemographicsRating | RankSeniors Poverty Over the Age of 75
Central Americans
0.0
/100
|
#280
Tragic
14.7%
Belizeans
0.0
/100
|
#281
Tragic
14.8%
Immigrants | Senegal
0.0
/100
|
#282
Tragic
14.8%
Guatemalans
0.0
/100
|
#283
Tragic
14.8%
Cheyenne
0.0
/100
|
#284
Tragic
14.9%
Immigrants | Mexico
0.0
/100
|
#285
Tragic
14.9%
Immigrants | Central America
0.0
/100
|
#286
Tragic
15.0%
Immigrants | Guatemala
0.0
/100
|
#287
Tragic
15.1%
Jamaicans
0.0
/100
|
#288
Tragic
15.1%
Immigrants | Belize
0.0
/100
|
#289
Tragic
15.2%
Immigrants | Azores
0.0
/100
|
#290
Tragic
15.2%
Paiute
0.0
/100
|
#291
Tragic
15.2%
Colville
0.0
/100
|
#292
Tragic
15.2%
Apache
0.0
/100
|
#293
Tragic
15.3%
Immigrants | Jamaica
0.0
/100
|
#294
Tragic
15.3%