Immigrants from Hungary vs Nonimmigrants Seniors Poverty Over the Age of 75
COMPARE
Immigrants from Hungary
Nonimmigrants
Seniors Poverty Over the Age of 75
Seniors Poverty Over the Age of 75 Comparison
Immigrants from Hungary
Nonimmigrants
11.8%
SENIORS POVERTY OVER THE AGE OF 75
81.7/ 100
METRIC RATING
128th/ 347
METRIC RANK
12.2%
SENIORS POVERTY OVER THE AGE OF 75
46.8/ 100
METRIC RATING
178th/ 347
METRIC RANK
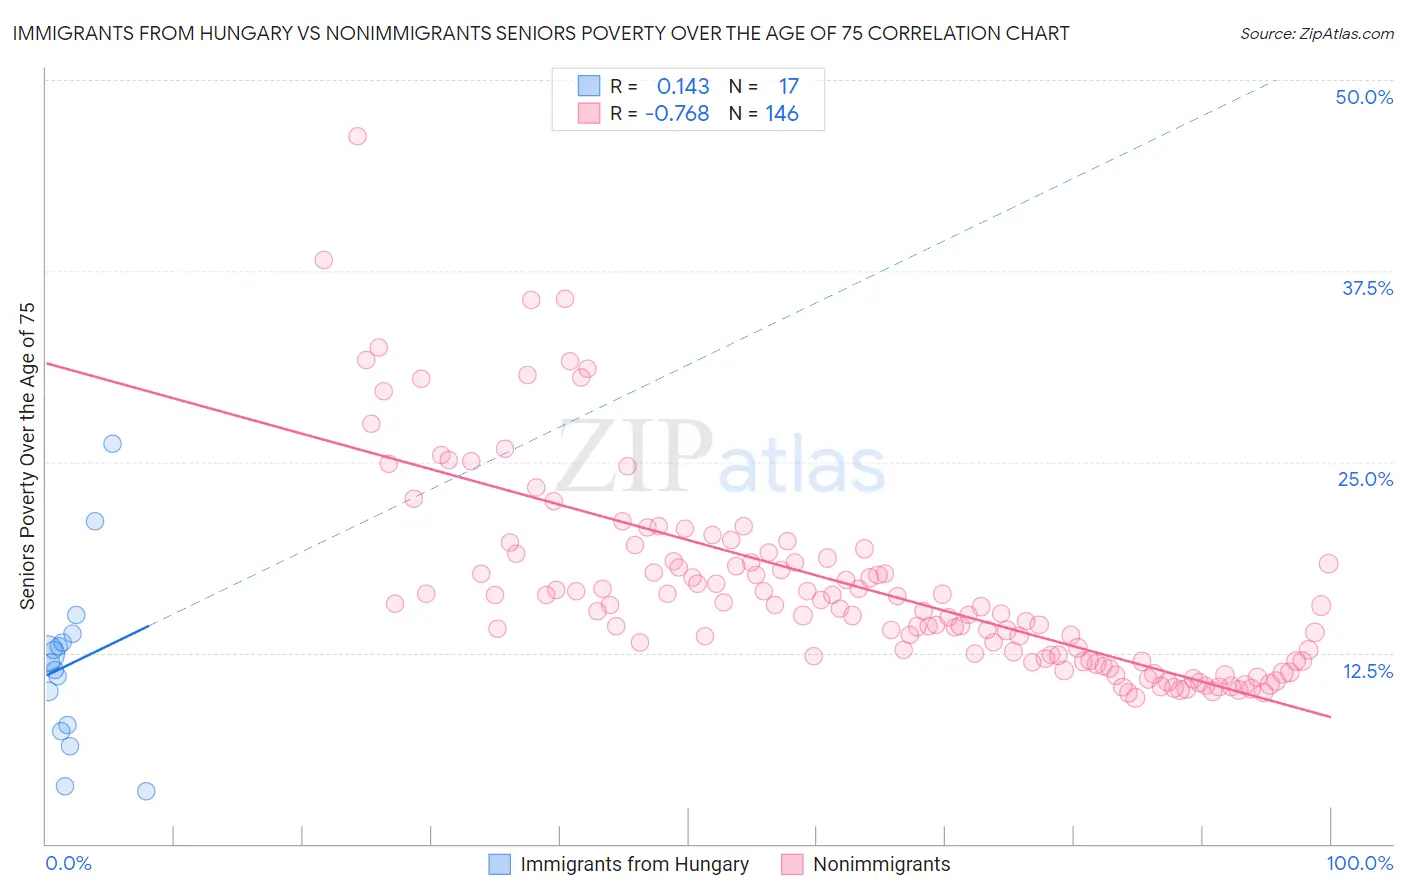
Immigrants from Hungary vs Nonimmigrants Seniors Poverty Over the Age of 75 Correlation Chart
The statistical analysis conducted on geographies consisting of 194,738,636 people shows a poor positive correlation between the proportion of Immigrants from Hungary and poverty level among seniors over the age of 75 in the United States with a correlation coefficient (R) of 0.143 and weighted average of 11.8%. Similarly, the statistical analysis conducted on geographies consisting of 564,663,130 people shows a strong negative correlation between the proportion of Nonimmigrants and poverty level among seniors over the age of 75 in the United States with a correlation coefficient (R) of -0.768 and weighted average of 12.2%, a difference of 3.4%.
Seniors Poverty Over the Age of 75 Correlation Summary
| Measurement | Immigrants from Hungary | Nonimmigrants |
| Minimum | 3.5% | 9.5% |
| Maximum | 26.2% | 46.3% |
| Range | 22.7% | 36.8% |
| Mean | 11.8% | 16.8% |
| Median | 11.8% | 15.5% |
| Interquartile 25% (IQ1) | 7.6% | 12.0% |
| Interquartile 75% (IQ3) | 13.5% | 18.5% |
| Interquartile Range (IQR) | 5.9% | 6.5% |
| Standard Deviation (Sample) | 5.7% | 6.5% |
| Standard Deviation (Population) | 5.5% | 6.5% |
Similar Demographics by Seniors Poverty Over the Age of 75
Demographics Similar to Immigrants from Hungary by Seniors Poverty Over the Age of 75
In terms of seniors poverty over the age of 75, the demographic groups most similar to Immigrants from Hungary are Immigrants from Denmark (11.8%, a difference of 0.12%), Ethiopian (11.8%, a difference of 0.15%), Spanish (11.8%, a difference of 0.17%), Pennsylvania German (11.8%, a difference of 0.24%), and Sudanese (11.8%, a difference of 0.28%).
| Demographics | Rating | Rank | Seniors Poverty Over the Age of 75 |
| Malaysians | 84.1 /100 | #121 | Excellent 11.8% |
| Pakistanis | 84.0 /100 | #122 | Excellent 11.8% |
| Immigrants | Italy | 84.0 /100 | #123 | Excellent 11.8% |
| Fijians | 83.8 /100 | #124 | Excellent 11.8% |
| Sudanese | 83.6 /100 | #125 | Excellent 11.8% |
| Pennsylvania Germans | 83.4 /100 | #126 | Excellent 11.8% |
| Immigrants | Denmark | 82.6 /100 | #127 | Excellent 11.8% |
| Immigrants | Hungary | 81.7 /100 | #128 | Excellent 11.8% |
| Ethiopians | 80.7 /100 | #129 | Excellent 11.8% |
| Spanish | 80.5 /100 | #130 | Excellent 11.8% |
| Immigrants | Western Europe | 79.6 /100 | #131 | Good 11.9% |
| Lebanese | 78.3 /100 | #132 | Good 11.9% |
| Immigrants | Sierra Leone | 77.6 /100 | #133 | Good 11.9% |
| Ugandans | 77.1 /100 | #134 | Good 11.9% |
| Immigrants | Ireland | 76.2 /100 | #135 | Good 11.9% |
Demographics Similar to Nonimmigrants by Seniors Poverty Over the Age of 75
In terms of seniors poverty over the age of 75, the demographic groups most similar to Nonimmigrants are Immigrants from Asia (12.2%, a difference of 0.080%), Immigrants from Iran (12.2%, a difference of 0.10%), Mongolian (12.2%, a difference of 0.11%), Immigrants from Saudi Arabia (12.2%, a difference of 0.21%), and Immigrants from South Eastern Asia (12.2%, a difference of 0.21%).
| Demographics | Rating | Rank | Seniors Poverty Over the Age of 75 |
| Spaniards | 51.6 /100 | #171 | Average 12.2% |
| Immigrants | Fiji | 51.5 /100 | #172 | Average 12.2% |
| Arabs | 50.5 /100 | #173 | Average 12.2% |
| Immigrants | Europe | 50.0 /100 | #174 | Average 12.2% |
| Immigrants | Saudi Arabia | 49.5 /100 | #175 | Average 12.2% |
| Immigrants | Iran | 48.1 /100 | #176 | Average 12.2% |
| Immigrants | Asia | 47.8 /100 | #177 | Average 12.2% |
| Immigrants | Nonimmigrants | 46.8 /100 | #178 | Average 12.2% |
| Mongolians | 45.5 /100 | #179 | Average 12.2% |
| Immigrants | South Eastern Asia | 44.3 /100 | #180 | Average 12.2% |
| Immigrants | Australia | 44.2 /100 | #181 | Average 12.2% |
| German Russians | 41.4 /100 | #182 | Average 12.3% |
| Laotians | 38.2 /100 | #183 | Fair 12.3% |
| Kiowa | 36.0 /100 | #184 | Fair 12.3% |
| Immigrants | Malaysia | 35.8 /100 | #185 | Fair 12.3% |