Immigrants from Guatemala vs Navajo Seniors Poverty Over the Age of 75
COMPARE
Immigrants from Guatemala
Navajo
Seniors Poverty Over the Age of 75
Seniors Poverty Over the Age of 75 Comparison
Immigrants from Guatemala
Navajo
15.1%
SENIORS POVERTY OVER THE AGE OF 75
0.0/ 100
METRIC RATING
287th/ 347
METRIC RANK
19.4%
SENIORS POVERTY OVER THE AGE OF 75
0.0/ 100
METRIC RATING
341st/ 347
METRIC RANK
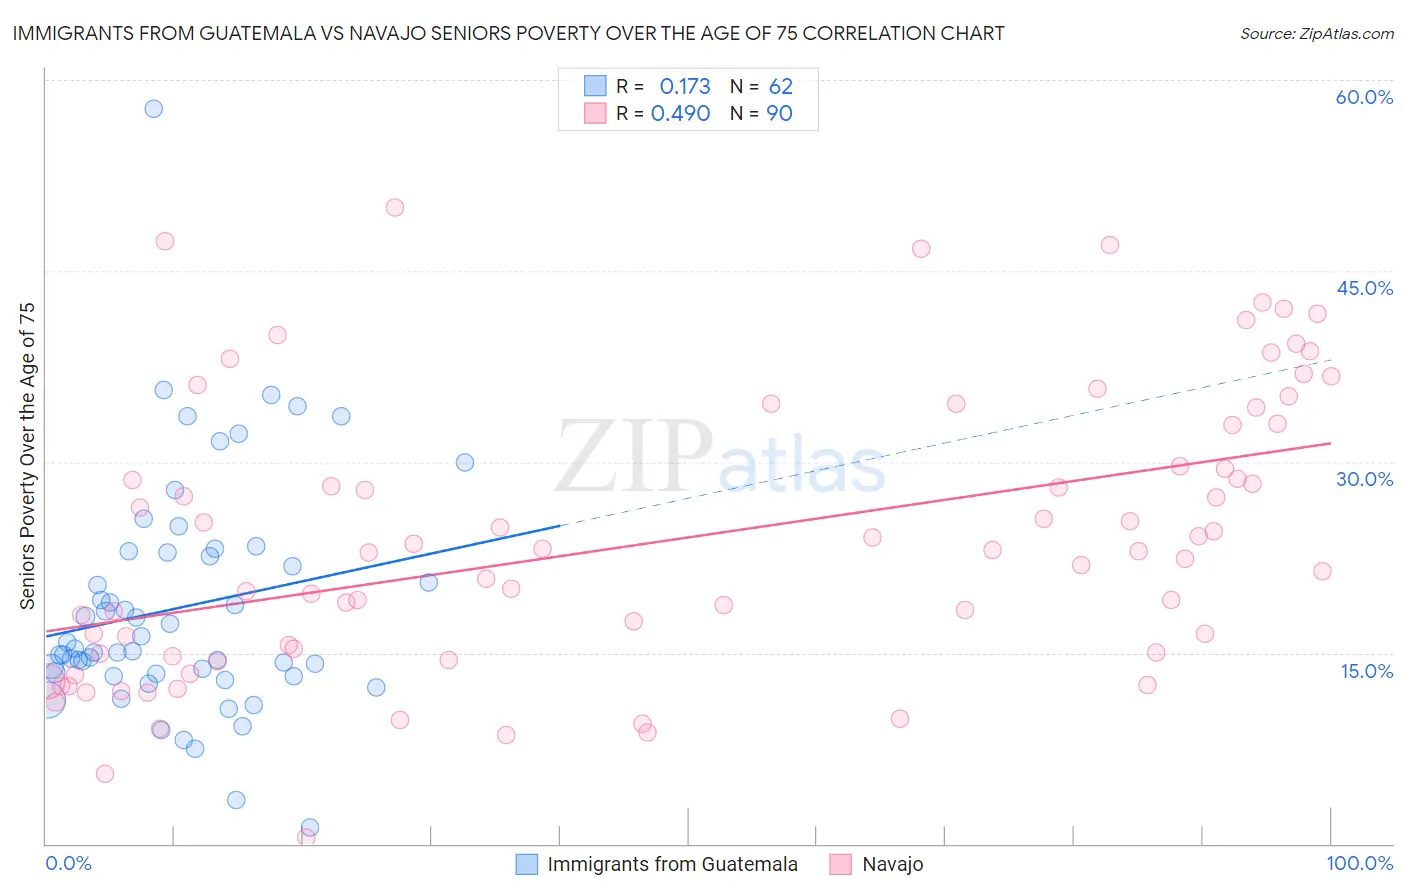
Immigrants from Guatemala vs Navajo Seniors Poverty Over the Age of 75 Correlation Chart
The statistical analysis conducted on geographies consisting of 373,963,984 people shows a poor positive correlation between the proportion of Immigrants from Guatemala and poverty level among seniors over the age of 75 in the United States with a correlation coefficient (R) of 0.173 and weighted average of 15.1%. Similarly, the statistical analysis conducted on geographies consisting of 222,735,587 people shows a moderate positive correlation between the proportion of Navajo and poverty level among seniors over the age of 75 in the United States with a correlation coefficient (R) of 0.490 and weighted average of 19.4%, a difference of 28.7%.
Seniors Poverty Over the Age of 75 Correlation Summary
| Measurement | Immigrants from Guatemala | Navajo |
| Minimum | 1.2% | 0.49% |
| Maximum | 57.8% | 50.0% |
| Range | 56.5% | 49.5% |
| Mean | 18.6% | 23.8% |
| Median | 15.2% | 22.9% |
| Interquartile 25% (IQ1) | 13.4% | 15.0% |
| Interquartile 75% (IQ3) | 22.9% | 32.9% |
| Interquartile Range (IQR) | 9.5% | 18.0% |
| Standard Deviation (Sample) | 9.3% | 11.1% |
| Standard Deviation (Population) | 9.2% | 11.0% |
Similar Demographics by Seniors Poverty Over the Age of 75
Demographics Similar to Immigrants from Guatemala by Seniors Poverty Over the Age of 75
In terms of seniors poverty over the age of 75, the demographic groups most similar to Immigrants from Guatemala are Immigrants from Central America (15.0%, a difference of 0.59%), Jamaican (15.1%, a difference of 0.60%), Immigrants from Belize (15.2%, a difference of 0.86%), Immigrants from the Azores (15.2%, a difference of 0.88%), and Paiute (15.2%, a difference of 0.89%).
| Demographics | Rating | Rank | Seniors Poverty Over the Age of 75 |
| Central Americans | 0.0 /100 | #280 | Tragic 14.7% |
| Belizeans | 0.0 /100 | #281 | Tragic 14.8% |
| Immigrants | Senegal | 0.0 /100 | #282 | Tragic 14.8% |
| Guatemalans | 0.0 /100 | #283 | Tragic 14.8% |
| Cheyenne | 0.0 /100 | #284 | Tragic 14.9% |
| Immigrants | Mexico | 0.0 /100 | #285 | Tragic 14.9% |
| Immigrants | Central America | 0.0 /100 | #286 | Tragic 15.0% |
| Immigrants | Guatemala | 0.0 /100 | #287 | Tragic 15.1% |
| Jamaicans | 0.0 /100 | #288 | Tragic 15.1% |
| Immigrants | Belize | 0.0 /100 | #289 | Tragic 15.2% |
| Immigrants | Azores | 0.0 /100 | #290 | Tragic 15.2% |
| Paiute | 0.0 /100 | #291 | Tragic 15.2% |
| Colville | 0.0 /100 | #292 | Tragic 15.2% |
| Apache | 0.0 /100 | #293 | Tragic 15.3% |
| Immigrants | Jamaica | 0.0 /100 | #294 | Tragic 15.3% |
Demographics Similar to Navajo by Seniors Poverty Over the Age of 75
In terms of seniors poverty over the age of 75, the demographic groups most similar to Navajo are Dominican (19.6%, a difference of 1.2%), Tohono O'odham (19.1%, a difference of 1.3%), Lumbee (19.7%, a difference of 1.9%), Immigrants from Cuba (19.9%, a difference of 2.7%), and Hopi (18.9%, a difference of 2.8%).
| Demographics | Rating | Rank | Seniors Poverty Over the Age of 75 |
| Immigrants | Nicaragua | 0.0 /100 | #333 | Tragic 17.6% |
| Immigrants | Grenada | 0.0 /100 | #334 | Tragic 17.8% |
| Cubans | 0.0 /100 | #335 | Tragic 18.0% |
| Immigrants | Caribbean | 0.0 /100 | #336 | Tragic 18.2% |
| Yakama | 0.0 /100 | #337 | Tragic 18.3% |
| Immigrants | Cabo Verde | 0.0 /100 | #338 | Tragic 18.5% |
| Hopi | 0.0 /100 | #339 | Tragic 18.9% |
| Tohono O'odham | 0.0 /100 | #340 | Tragic 19.1% |
| Navajo | 0.0 /100 | #341 | Tragic 19.4% |
| Dominicans | 0.0 /100 | #342 | Tragic 19.6% |
| Lumbee | 0.0 /100 | #343 | Tragic 19.7% |
| Immigrants | Cuba | 0.0 /100 | #344 | Tragic 19.9% |
| Immigrants | Dominican Republic | 0.0 /100 | #345 | Tragic 20.1% |
| Puerto Ricans | 0.0 /100 | #346 | Tragic 23.2% |
| Pima | 0.0 /100 | #347 | Tragic 23.9% |