Immigrants from Hungary vs Navajo Householder Income Ages 25 - 44 years
COMPARE
Immigrants from Hungary
Navajo
Householder Income Ages 25 - 44 years
Householder Income Ages 25 - 44 years Comparison
Immigrants from Hungary
Navajo
$102,655
HOUSEHOLDER INCOME AGES 25 - 44 YEARS
98.9/ 100
METRIC RATING
86th/ 347
METRIC RANK
$66,529
HOUSEHOLDER INCOME AGES 25 - 44 YEARS
0.0/ 100
METRIC RATING
345th/ 347
METRIC RANK
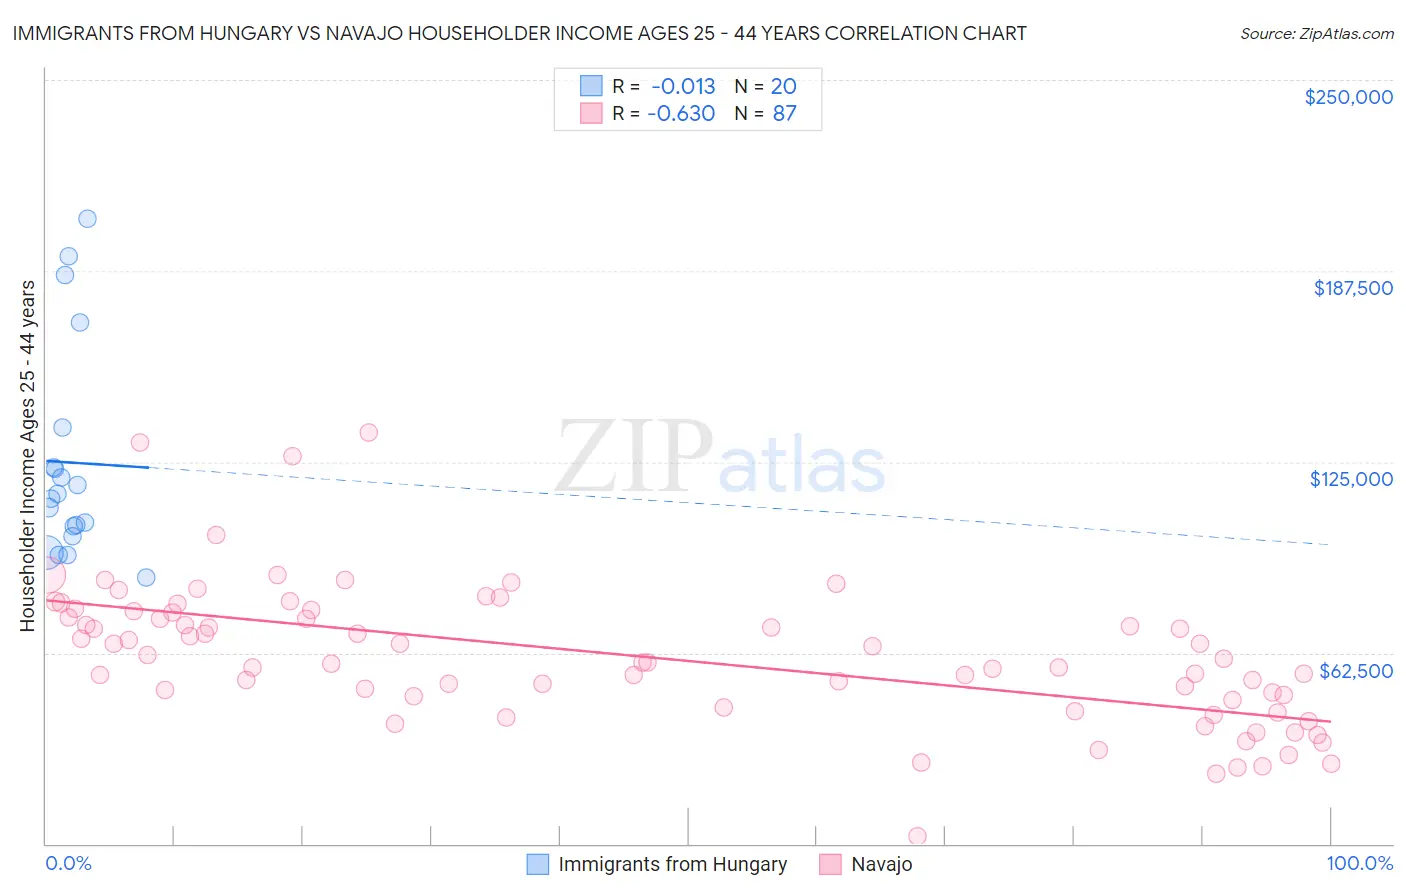
Immigrants from Hungary vs Navajo Householder Income Ages 25 - 44 years Correlation Chart
The statistical analysis conducted on geographies consisting of 195,432,328 people shows no correlation between the proportion of Immigrants from Hungary and household income with householder between the ages 25 and 44 in the United States with a correlation coefficient (R) of -0.013 and weighted average of $102,655. Similarly, the statistical analysis conducted on geographies consisting of 224,307,883 people shows a significant negative correlation between the proportion of Navajo and household income with householder between the ages 25 and 44 in the United States with a correlation coefficient (R) of -0.630 and weighted average of $66,529, a difference of 54.3%.
Householder Income Ages 25 - 44 years Correlation Summary
| Measurement | Immigrants from Hungary | Navajo |
| Minimum | $87,083 | $2,499 |
| Maximum | $204,500 | $134,464 |
| Range | $117,417 | $131,965 |
| Mean | $124,821 | $61,342 |
| Median | $113,628 | $59,389 |
| Interquartile 25% (IQ1) | $102,263 | $47,194 |
| Interquartile 75% (IQ3) | $129,764 | $75,867 |
| Interquartile Range (IQR) | $27,501 | $28,673 |
| Standard Deviation (Sample) | $35,106 | $22,974 |
| Standard Deviation (Population) | $34,217 | $22,841 |
Similar Demographics by Householder Income Ages 25 - 44 years
Demographics Similar to Immigrants from Hungary by Householder Income Ages 25 - 44 years
In terms of householder income ages 25 - 44 years, the demographic groups most similar to Immigrants from Hungary are Immigrants from Western Europe ($102,654, a difference of 0.0%), Immigrants from Ukraine ($102,664, a difference of 0.010%), Immigrants from Canada ($102,616, a difference of 0.040%), Romanian ($102,544, a difference of 0.11%), and Ukrainian ($102,451, a difference of 0.20%).
| Demographics | Rating | Rank | Householder Income Ages 25 - 44 years |
| Armenians | 99.2 /100 | #79 | Exceptional $103,248 |
| Immigrants | Egypt | 99.2 /100 | #80 | Exceptional $103,192 |
| South Africans | 99.2 /100 | #81 | Exceptional $103,160 |
| Immigrants | Serbia | 99.2 /100 | #82 | Exceptional $103,155 |
| Argentineans | 99.1 /100 | #83 | Exceptional $103,111 |
| Immigrants | Philippines | 99.0 /100 | #84 | Exceptional $102,910 |
| Immigrants | Ukraine | 98.9 /100 | #85 | Exceptional $102,664 |
| Immigrants | Hungary | 98.9 /100 | #86 | Exceptional $102,655 |
| Immigrants | Western Europe | 98.9 /100 | #87 | Exceptional $102,654 |
| Immigrants | Canada | 98.9 /100 | #88 | Exceptional $102,616 |
| Romanians | 98.8 /100 | #89 | Exceptional $102,544 |
| Ukrainians | 98.8 /100 | #90 | Exceptional $102,451 |
| Croatians | 98.7 /100 | #91 | Exceptional $102,414 |
| Immigrants | North America | 98.7 /100 | #92 | Exceptional $102,407 |
| Immigrants | England | 98.4 /100 | #93 | Exceptional $102,020 |
Demographics Similar to Navajo by Householder Income Ages 25 - 44 years
In terms of householder income ages 25 - 44 years, the demographic groups most similar to Navajo are Puerto Rican ($65,996, a difference of 0.81%), Pueblo ($68,910, a difference of 3.6%), Tohono O'odham ($69,068, a difference of 3.8%), Crow ($71,337, a difference of 7.2%), and Arapaho ($71,697, a difference of 7.8%).
| Demographics | Rating | Rank | Householder Income Ages 25 - 44 years |
| Hopi | 0.0 /100 | #333 | Tragic $75,002 |
| Creek | 0.0 /100 | #334 | Tragic $74,847 |
| Kiowa | 0.0 /100 | #335 | Tragic $74,776 |
| Yup'ik | 0.0 /100 | #336 | Tragic $73,688 |
| Blacks/African Americans | 0.0 /100 | #337 | Tragic $73,370 |
| Immigrants | Yemen | 0.0 /100 | #338 | Tragic $73,043 |
| Yuman | 0.0 /100 | #339 | Tragic $72,956 |
| Immigrants | Congo | 0.0 /100 | #340 | Tragic $72,178 |
| Arapaho | 0.0 /100 | #341 | Tragic $71,697 |
| Crow | 0.0 /100 | #342 | Tragic $71,337 |
| Tohono O'odham | 0.0 /100 | #343 | Tragic $69,068 |
| Pueblo | 0.0 /100 | #344 | Tragic $68,910 |
| Navajo | 0.0 /100 | #345 | Tragic $66,529 |
| Puerto Ricans | 0.0 /100 | #346 | Tragic $65,996 |
| Lumbee | 0.0 /100 | #347 | Tragic $60,305 |