Immigrants from Hong Kong vs Haitian 5th Grade
COMPARE
Immigrants from Hong Kong
Haitian
5th Grade
5th Grade Comparison
Immigrants from Hong Kong
Haitians
96.7%
5TH GRADE
0.2/ 100
METRIC RATING
271st/ 347
METRIC RANK
96.3%
5TH GRADE
0.0/ 100
METRIC RATING
297th/ 347
METRIC RANK
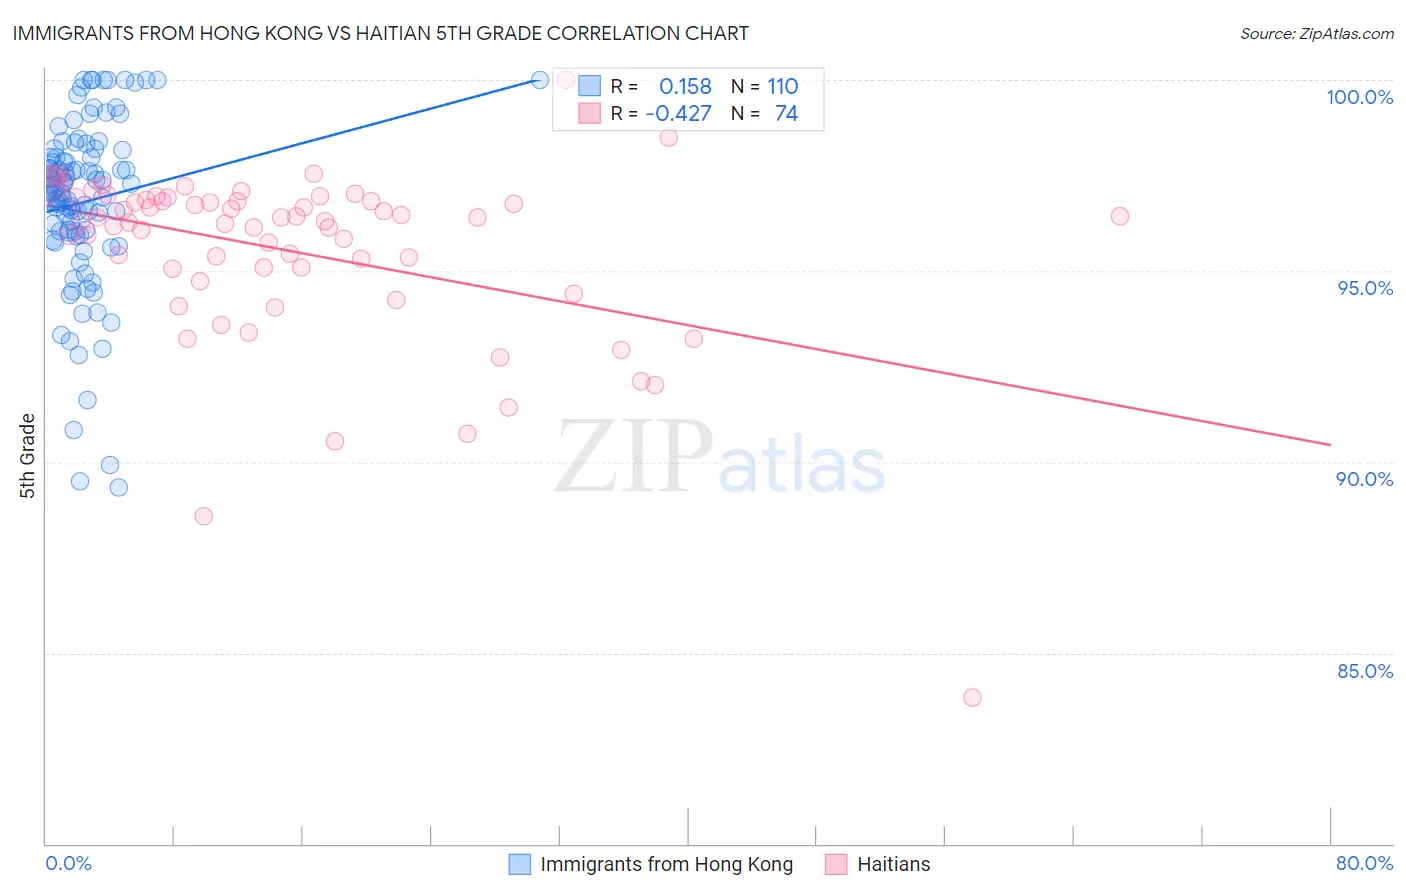
Immigrants from Hong Kong vs Haitian 5th Grade Correlation Chart
The statistical analysis conducted on geographies consisting of 253,908,350 people shows a poor positive correlation between the proportion of Immigrants from Hong Kong and percentage of population with at least 5th grade education in the United States with a correlation coefficient (R) of 0.158 and weighted average of 96.7%. Similarly, the statistical analysis conducted on geographies consisting of 288,018,742 people shows a moderate negative correlation between the proportion of Haitians and percentage of population with at least 5th grade education in the United States with a correlation coefficient (R) of -0.427 and weighted average of 96.3%, a difference of 0.44%.
5th Grade Correlation Summary
| Measurement | Immigrants from Hong Kong | Haitian |
| Minimum | 89.3% | 83.8% |
| Maximum | 100.0% | 100.0% |
| Range | 10.7% | 16.2% |
| Mean | 96.8% | 95.5% |
| Median | 97.2% | 96.3% |
| Interquartile 25% (IQ1) | 96.0% | 95.1% |
| Interquartile 75% (IQ3) | 98.0% | 96.8% |
| Interquartile Range (IQR) | 2.0% | 1.8% |
| Standard Deviation (Sample) | 2.2% | 2.4% |
| Standard Deviation (Population) | 2.2% | 2.4% |
Similar Demographics by 5th Grade
Demographics Similar to Immigrants from Hong Kong by 5th Grade
In terms of 5th grade, the demographic groups most similar to Immigrants from Hong Kong are Afghan (96.7%, a difference of 0.0%), Trinidadian and Tobagonian (96.7%, a difference of 0.010%), Yaqui (96.7%, a difference of 0.020%), Immigrants from Cameroon (96.7%, a difference of 0.020%), and Immigrants from Peru (96.6%, a difference of 0.030%).
| Demographics | Rating | Rank | 5th Grade |
| West Indians | 0.3 /100 | #264 | Tragic 96.8% |
| Taiwanese | 0.3 /100 | #265 | Tragic 96.7% |
| Immigrants | Nigeria | 0.3 /100 | #266 | Tragic 96.7% |
| Immigrants | South America | 0.3 /100 | #267 | Tragic 96.7% |
| Armenians | 0.3 /100 | #268 | Tragic 96.7% |
| Ghanaians | 0.2 /100 | #269 | Tragic 96.7% |
| Afghans | 0.2 /100 | #270 | Tragic 96.7% |
| Immigrants | Hong Kong | 0.2 /100 | #271 | Tragic 96.7% |
| Trinidadians and Tobagonians | 0.1 /100 | #272 | Tragic 96.7% |
| Yaqui | 0.1 /100 | #273 | Tragic 96.7% |
| Immigrants | Cameroon | 0.1 /100 | #274 | Tragic 96.7% |
| Immigrants | Peru | 0.1 /100 | #275 | Tragic 96.6% |
| Cubans | 0.1 /100 | #276 | Tragic 96.6% |
| Immigrants | Bolivia | 0.1 /100 | #277 | Tragic 96.6% |
| Immigrants | Ghana | 0.1 /100 | #278 | Tragic 96.6% |
Demographics Similar to Haitians by 5th Grade
In terms of 5th grade, the demographic groups most similar to Haitians are Immigrants from South Eastern Asia (96.3%, a difference of 0.030%), Immigrants from Dominica (96.2%, a difference of 0.050%), Immigrants (96.2%, a difference of 0.080%), Immigrants from Somalia (96.4%, a difference of 0.13%), and Sri Lankan (96.1%, a difference of 0.13%).
| Demographics | Rating | Rank | 5th Grade |
| British West Indians | 0.0 /100 | #290 | Tragic 96.5% |
| Malaysians | 0.0 /100 | #291 | Tragic 96.5% |
| Somalis | 0.0 /100 | #292 | Tragic 96.5% |
| Immigrants | Grenada | 0.0 /100 | #293 | Tragic 96.5% |
| Immigrants | Eritrea | 0.0 /100 | #294 | Tragic 96.4% |
| Immigrants | Somalia | 0.0 /100 | #295 | Tragic 96.4% |
| Immigrants | South Eastern Asia | 0.0 /100 | #296 | Tragic 96.3% |
| Haitians | 0.0 /100 | #297 | Tragic 96.3% |
| Immigrants | Dominica | 0.0 /100 | #298 | Tragic 96.2% |
| Immigrants | Immigrants | 0.0 /100 | #299 | Tragic 96.2% |
| Sri Lankans | 0.0 /100 | #300 | Tragic 96.1% |
| Immigrants | Cuba | 0.0 /100 | #301 | Tragic 96.1% |
| Guyanese | 0.0 /100 | #302 | Tragic 96.1% |
| Puerto Ricans | 0.0 /100 | #303 | Tragic 96.1% |
| Immigrants | Burma/Myanmar | 0.0 /100 | #304 | Tragic 96.1% |