Immigrants from Hong Kong vs Immigrants from Denmark Single Mother Poverty
COMPARE
Immigrants from Hong Kong
Immigrants from Denmark
Single Mother Poverty
Single Mother Poverty Comparison
Immigrants from Hong Kong
Immigrants from Denmark
24.4%
SINGLE MOTHER POVERTY
100.0/ 100
METRIC RATING
5th/ 347
METRIC RANK
28.5%
SINGLE MOTHER POVERTY
86.1/ 100
METRIC RATING
146th/ 347
METRIC RANK
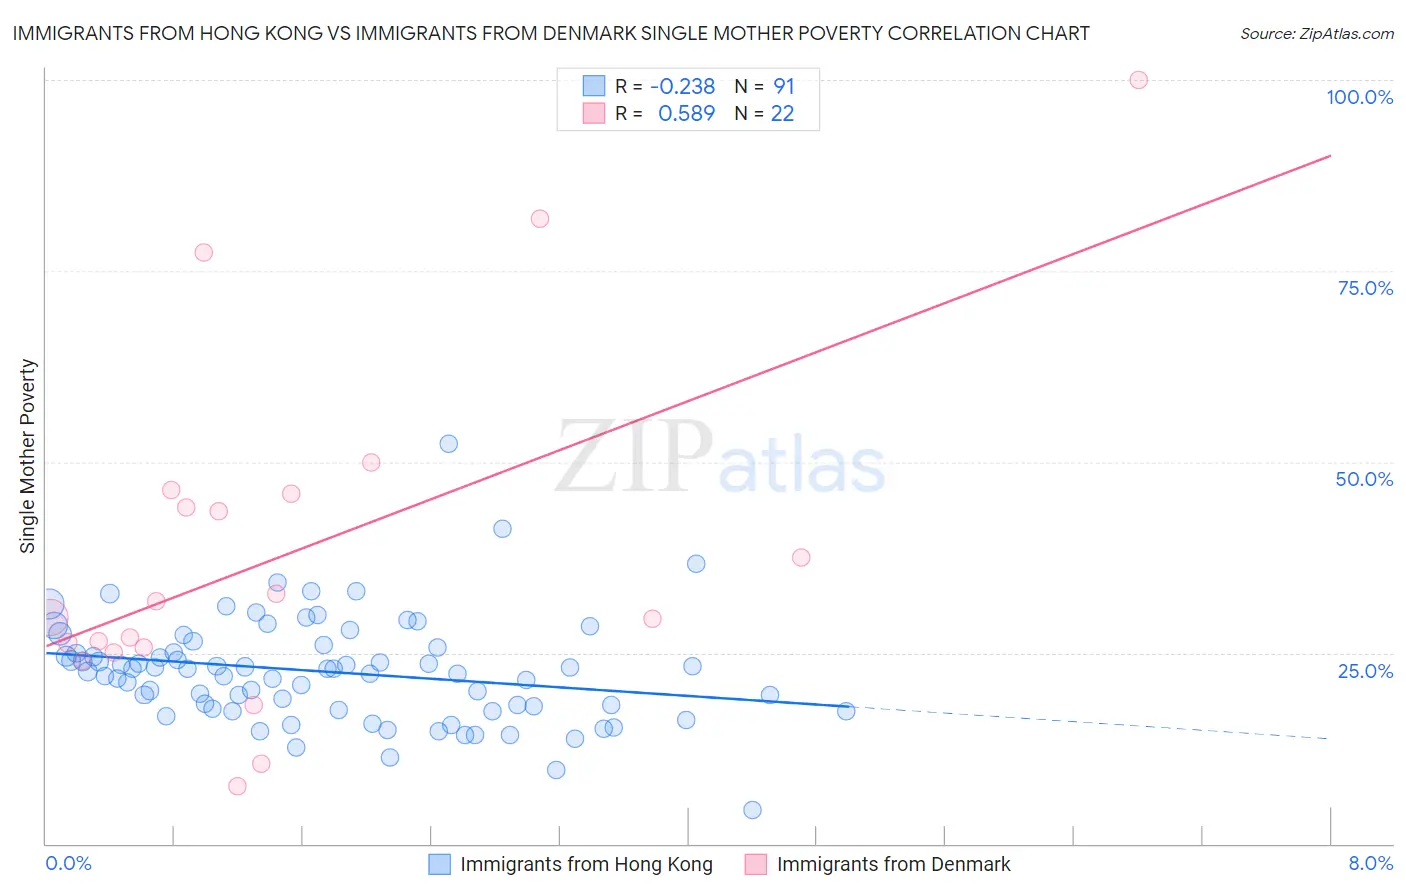
Immigrants from Hong Kong vs Immigrants from Denmark Single Mother Poverty Correlation Chart
The statistical analysis conducted on geographies consisting of 248,457,353 people shows a weak negative correlation between the proportion of Immigrants from Hong Kong and poverty level among single mothers in the United States with a correlation coefficient (R) of -0.238 and weighted average of 24.4%. Similarly, the statistical analysis conducted on geographies consisting of 134,367,924 people shows a substantial positive correlation between the proportion of Immigrants from Denmark and poverty level among single mothers in the United States with a correlation coefficient (R) of 0.589 and weighted average of 28.5%, a difference of 17.1%.
Single Mother Poverty Correlation Summary
| Measurement | Immigrants from Hong Kong | Immigrants from Denmark |
| Minimum | 4.5% | 7.5% |
| Maximum | 52.3% | 100.0% |
| Range | 47.8% | 92.5% |
| Mean | 22.5% | 38.2% |
| Median | 22.9% | 30.7% |
| Interquartile 25% (IQ1) | 17.7% | 25.7% |
| Interquartile 75% (IQ3) | 25.6% | 45.8% |
| Interquartile Range (IQR) | 7.9% | 20.1% |
| Standard Deviation (Sample) | 7.0% | 22.7% |
| Standard Deviation (Population) | 6.9% | 22.2% |
Similar Demographics by Single Mother Poverty
Demographics Similar to Immigrants from Hong Kong by Single Mother Poverty
In terms of single mother poverty, the demographic groups most similar to Immigrants from Hong Kong are Filipino (24.3%, a difference of 0.23%), Thai (24.5%, a difference of 0.49%), Chinese (24.6%, a difference of 1.0%), Immigrants from Taiwan (23.9%, a difference of 2.1%), and Immigrants from India (23.8%, a difference of 2.4%).
| Demographics | Rating | Rank | Single Mother Poverty |
| Assyrians/Chaldeans/Syriacs | 100.0 /100 | #1 | Exceptional 23.8% |
| Immigrants | India | 100.0 /100 | #2 | Exceptional 23.8% |
| Immigrants | Taiwan | 100.0 /100 | #3 | Exceptional 23.9% |
| Filipinos | 100.0 /100 | #4 | Exceptional 24.3% |
| Immigrants | Hong Kong | 100.0 /100 | #5 | Exceptional 24.4% |
| Thais | 100.0 /100 | #6 | Exceptional 24.5% |
| Chinese | 100.0 /100 | #7 | Exceptional 24.6% |
| Immigrants | Iran | 100.0 /100 | #8 | Exceptional 25.1% |
| Immigrants | Lithuania | 100.0 /100 | #9 | Exceptional 25.2% |
| Immigrants | South Central Asia | 100.0 /100 | #10 | Exceptional 25.3% |
| Iranians | 100.0 /100 | #11 | Exceptional 25.5% |
| Bhutanese | 100.0 /100 | #12 | Exceptional 25.6% |
| Indians (Asian) | 100.0 /100 | #13 | Exceptional 25.8% |
| Immigrants | Singapore | 100.0 /100 | #14 | Exceptional 25.8% |
| Immigrants | Ireland | 100.0 /100 | #15 | Exceptional 25.8% |
Demographics Similar to Immigrants from Denmark by Single Mother Poverty
In terms of single mother poverty, the demographic groups most similar to Immigrants from Denmark are Immigrants from South America (28.5%, a difference of 0.0%), Luxembourger (28.5%, a difference of 0.040%), Immigrants from North America (28.5%, a difference of 0.050%), South African (28.5%, a difference of 0.060%), and Immigrants from Lebanon (28.6%, a difference of 0.070%).
| Demographics | Rating | Rank | Single Mother Poverty |
| Samoans | 88.1 /100 | #139 | Excellent 28.5% |
| Immigrants | Colombia | 88.0 /100 | #140 | Excellent 28.5% |
| Danes | 87.1 /100 | #141 | Excellent 28.5% |
| South Africans | 86.6 /100 | #142 | Excellent 28.5% |
| Immigrants | North America | 86.5 /100 | #143 | Excellent 28.5% |
| Luxembourgers | 86.4 /100 | #144 | Excellent 28.5% |
| Immigrants | South America | 86.1 /100 | #145 | Excellent 28.5% |
| Immigrants | Denmark | 86.1 /100 | #146 | Excellent 28.5% |
| Immigrants | Lebanon | 85.3 /100 | #147 | Excellent 28.6% |
| Syrians | 85.3 /100 | #148 | Excellent 28.6% |
| Serbians | 85.0 /100 | #149 | Excellent 28.6% |
| Northern Europeans | 81.7 /100 | #150 | Excellent 28.6% |
| Immigrants | Oceania | 79.9 /100 | #151 | Good 28.7% |
| Austrians | 79.0 /100 | #152 | Good 28.7% |
| Slovenes | 76.4 /100 | #153 | Good 28.8% |