Immigrants from Middle Africa vs Comanche Female Poverty Among 25-34 Year Olds
COMPARE
Immigrants from Middle Africa
Comanche
Female Poverty Among 25-34 Year Olds
Female Poverty Among 25-34 Year Olds Comparison
Immigrants from Middle Africa
Comanche
14.8%
FEMALE POVERTY AMONG 25-34 YEAR OLDS
1.0/ 100
METRIC RATING
245th/ 347
METRIC RANK
16.5%
FEMALE POVERTY AMONG 25-34 YEAR OLDS
0.0/ 100
METRIC RATING
291st/ 347
METRIC RANK
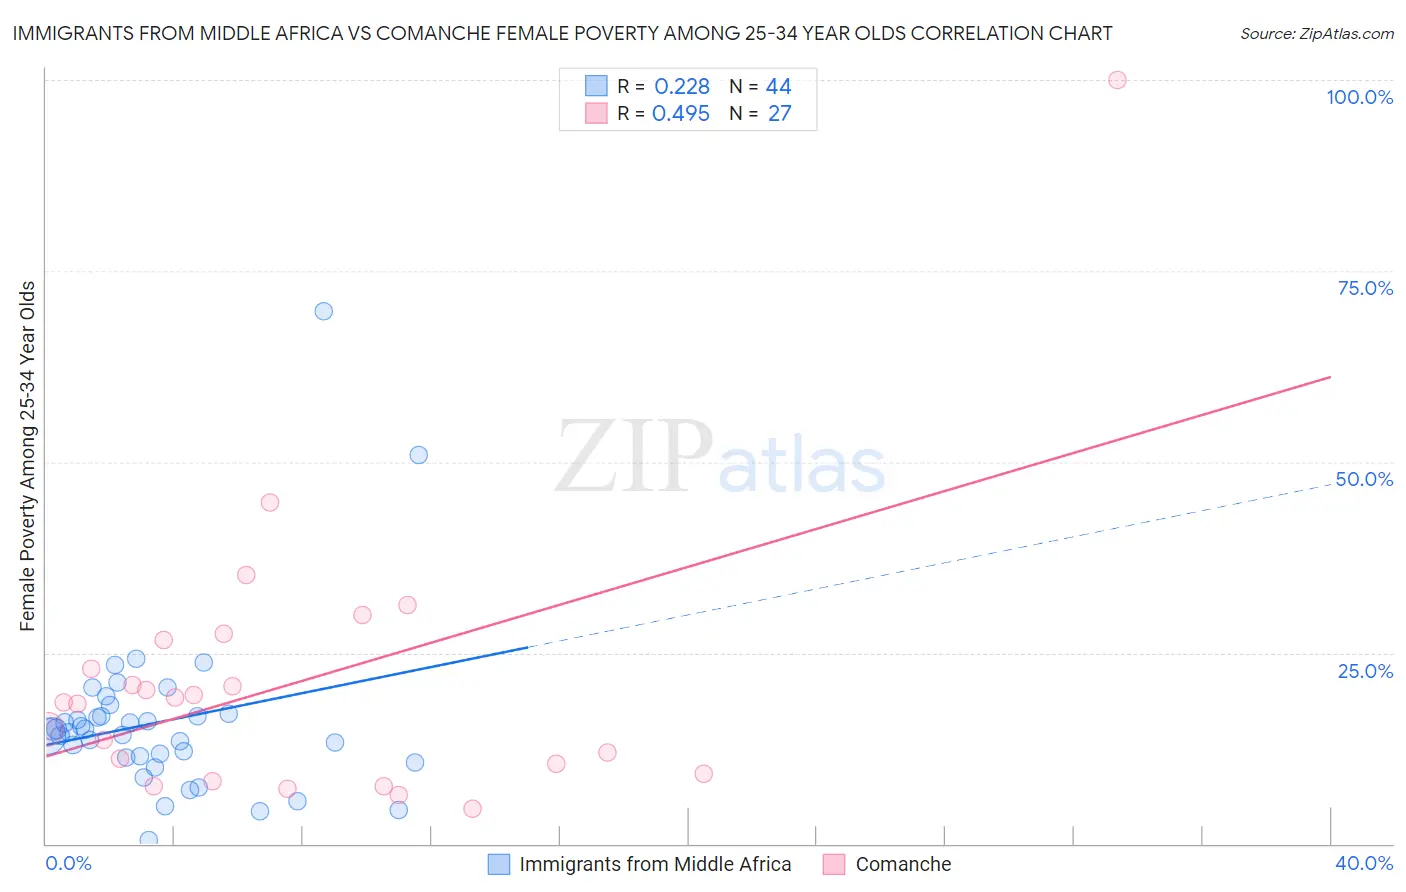
Immigrants from Middle Africa vs Comanche Female Poverty Among 25-34 Year Olds Correlation Chart
The statistical analysis conducted on geographies consisting of 201,471,968 people shows a weak positive correlation between the proportion of Immigrants from Middle Africa and poverty level among females between the ages 25 and 34 in the United States with a correlation coefficient (R) of 0.228 and weighted average of 14.8%. Similarly, the statistical analysis conducted on geographies consisting of 109,487,317 people shows a moderate positive correlation between the proportion of Comanche and poverty level among females between the ages 25 and 34 in the United States with a correlation coefficient (R) of 0.495 and weighted average of 16.5%, a difference of 11.1%.
Female Poverty Among 25-34 Year Olds Correlation Summary
| Measurement | Immigrants from Middle Africa | Comanche |
| Minimum | 0.42% | 4.5% |
| Maximum | 69.6% | 100.0% |
| Range | 69.2% | 95.5% |
| Mean | 16.0% | 21.0% |
| Median | 14.8% | 18.5% |
| Interquartile 25% (IQ1) | 11.4% | 9.1% |
| Interquartile 75% (IQ3) | 16.8% | 26.7% |
| Interquartile Range (IQR) | 5.5% | 17.6% |
| Standard Deviation (Sample) | 11.3% | 18.6% |
| Standard Deviation (Population) | 11.2% | 18.3% |
Similar Demographics by Female Poverty Among 25-34 Year Olds
Demographics Similar to Immigrants from Middle Africa by Female Poverty Among 25-34 Year Olds
In terms of female poverty among 25-34 year olds, the demographic groups most similar to Immigrants from Middle Africa are Jamaican (14.8%, a difference of 0.040%), Immigrants from Bangladesh (14.8%, a difference of 0.18%), Immigrants from Nicaragua (14.8%, a difference of 0.19%), Scotch-Irish (14.8%, a difference of 0.22%), and Barbadian (14.8%, a difference of 0.22%).
| Demographics | Rating | Rank | Female Poverty Among 25-34 Year Olds |
| Alsatians | 1.4 /100 | #238 | Tragic 14.7% |
| Malaysians | 1.4 /100 | #239 | Tragic 14.7% |
| Immigrants | Grenada | 1.3 /100 | #240 | Tragic 14.7% |
| Scotch-Irish | 1.2 /100 | #241 | Tragic 14.8% |
| Barbadians | 1.2 /100 | #242 | Tragic 14.8% |
| Immigrants | Nicaragua | 1.1 /100 | #243 | Tragic 14.8% |
| Immigrants | Bangladesh | 1.1 /100 | #244 | Tragic 14.8% |
| Immigrants | Middle Africa | 1.0 /100 | #245 | Tragic 14.8% |
| Jamaicans | 1.0 /100 | #246 | Tragic 14.8% |
| German Russians | 0.8 /100 | #247 | Tragic 14.9% |
| Immigrants | Western Africa | 0.8 /100 | #248 | Tragic 14.9% |
| Immigrants | Haiti | 0.5 /100 | #249 | Tragic 15.0% |
| Immigrants | El Salvador | 0.5 /100 | #250 | Tragic 15.0% |
| Haitians | 0.5 /100 | #251 | Tragic 15.0% |
| Belizeans | 0.4 /100 | #252 | Tragic 15.1% |
Demographics Similar to Comanche by Female Poverty Among 25-34 Year Olds
In terms of female poverty among 25-34 year olds, the demographic groups most similar to Comanche are Immigrants from Dominica (16.5%, a difference of 0.010%), Indonesian (16.4%, a difference of 0.28%), Potawatomi (16.5%, a difference of 0.28%), Osage (16.4%, a difference of 0.44%), and Guatemalan (16.4%, a difference of 0.50%).
| Demographics | Rating | Rank | Female Poverty Among 25-34 Year Olds |
| Shoshone | 0.0 /100 | #284 | Tragic 16.2% |
| Immigrants | Bahamas | 0.0 /100 | #285 | Tragic 16.3% |
| Cape Verdeans | 0.0 /100 | #286 | Tragic 16.3% |
| Americans | 0.0 /100 | #287 | Tragic 16.4% |
| Guatemalans | 0.0 /100 | #288 | Tragic 16.4% |
| Osage | 0.0 /100 | #289 | Tragic 16.4% |
| Indonesians | 0.0 /100 | #290 | Tragic 16.4% |
| Comanche | 0.0 /100 | #291 | Tragic 16.5% |
| Immigrants | Dominica | 0.0 /100 | #292 | Tragic 16.5% |
| Potawatomi | 0.0 /100 | #293 | Tragic 16.5% |
| Immigrants | Central America | 0.0 /100 | #294 | Tragic 16.6% |
| Mexicans | 0.0 /100 | #295 | Tragic 16.6% |
| Hispanics or Latinos | 0.0 /100 | #296 | Tragic 16.6% |
| Immigrants | Guatemala | 0.0 /100 | #297 | Tragic 16.6% |
| Blackfeet | 0.0 /100 | #298 | Tragic 16.7% |