Immigrants from Honduras vs Comanche Child Poverty Under the Age of 5
COMPARE
Immigrants from Honduras
Comanche
Child Poverty Under the Age of 5
Child Poverty Under the Age of 5 Comparison
Immigrants from Honduras
Comanche
23.5%
CHILD POVERTY UNDER THE AGE OF 5
0.0/ 100
METRIC RATING
321st/ 347
METRIC RANK
21.0%
CHILD POVERTY UNDER THE AGE OF 5
0.0/ 100
METRIC RATING
283rd/ 347
METRIC RANK
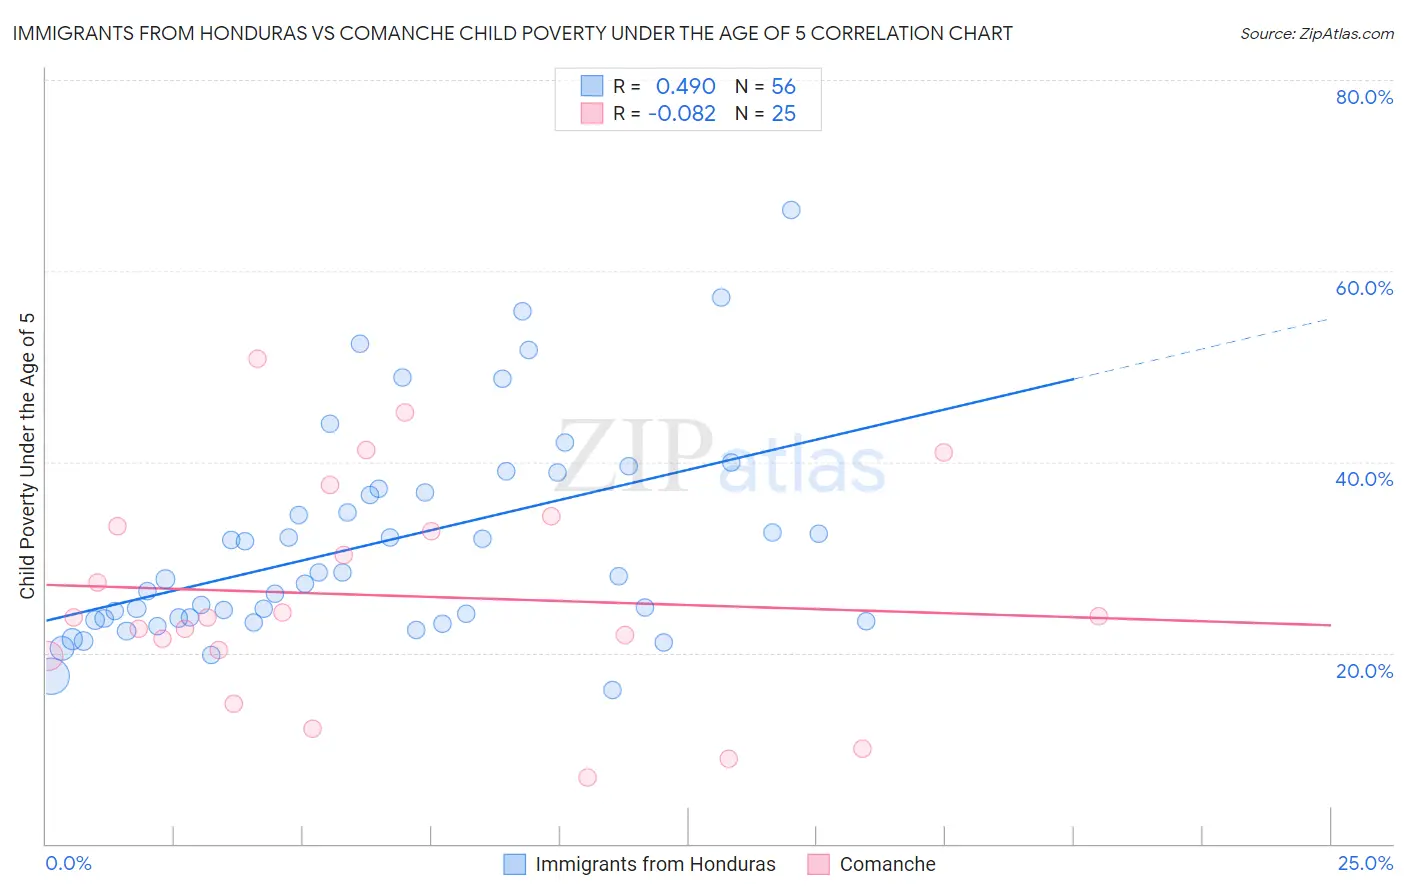
Immigrants from Honduras vs Comanche Child Poverty Under the Age of 5 Correlation Chart
The statistical analysis conducted on geographies consisting of 316,401,171 people shows a moderate positive correlation between the proportion of Immigrants from Honduras and poverty level among children under the age of 5 in the United States with a correlation coefficient (R) of 0.490 and weighted average of 23.5%. Similarly, the statistical analysis conducted on geographies consisting of 108,975,573 people shows a slight negative correlation between the proportion of Comanche and poverty level among children under the age of 5 in the United States with a correlation coefficient (R) of -0.082 and weighted average of 21.0%, a difference of 11.6%.
Child Poverty Under the Age of 5 Correlation Summary
| Measurement | Immigrants from Honduras | Comanche |
| Minimum | 16.1% | 6.9% |
| Maximum | 66.4% | 50.7% |
| Range | 50.2% | 43.8% |
| Mean | 31.5% | 26.0% |
| Median | 27.9% | 23.8% |
| Interquartile 25% (IQ1) | 23.5% | 20.0% |
| Interquartile 75% (IQ3) | 37.0% | 33.8% |
| Interquartile Range (IQR) | 13.5% | 13.8% |
| Standard Deviation (Sample) | 11.0% | 11.5% |
| Standard Deviation (Population) | 10.9% | 11.2% |
Similar Demographics by Child Poverty Under the Age of 5
Demographics Similar to Immigrants from Honduras by Child Poverty Under the Age of 5
In terms of child poverty under the age of 5, the demographic groups most similar to Immigrants from Honduras are Choctaw (23.5%, a difference of 0.030%), Ute (23.5%, a difference of 0.23%), Chippewa (23.4%, a difference of 0.41%), Pueblo (23.7%, a difference of 0.81%), and Dutch West Indian (23.3%, a difference of 0.89%).
| Demographics | Rating | Rank | Child Poverty Under the Age of 5 |
| U.S. Virgin Islanders | 0.0 /100 | #314 | Tragic 23.0% |
| Arapaho | 0.0 /100 | #315 | Tragic 23.1% |
| Yakama | 0.0 /100 | #316 | Tragic 23.1% |
| Menominee | 0.0 /100 | #317 | Tragic 23.3% |
| Dutch West Indians | 0.0 /100 | #318 | Tragic 23.3% |
| Chippewa | 0.0 /100 | #319 | Tragic 23.4% |
| Choctaw | 0.0 /100 | #320 | Tragic 23.5% |
| Immigrants | Honduras | 0.0 /100 | #321 | Tragic 23.5% |
| Ute | 0.0 /100 | #322 | Tragic 23.5% |
| Pueblo | 0.0 /100 | #323 | Tragic 23.7% |
| Paiute | 0.0 /100 | #324 | Tragic 23.8% |
| Immigrants | Congo | 0.0 /100 | #325 | Tragic 23.9% |
| Central American Indians | 0.0 /100 | #326 | Tragic 23.9% |
| Dominicans | 0.0 /100 | #327 | Tragic 24.0% |
| Immigrants | Dominican Republic | 0.0 /100 | #328 | Tragic 24.1% |
Demographics Similar to Comanche by Child Poverty Under the Age of 5
In terms of child poverty under the age of 5, the demographic groups most similar to Comanche are Potawatomi (21.0%, a difference of 0.20%), Somali (21.1%, a difference of 0.33%), Senegalese (20.9%, a difference of 0.74%), Haitian (21.2%, a difference of 0.80%), and Immigrants from Latin America (21.2%, a difference of 0.88%).
| Demographics | Rating | Rank | Child Poverty Under the Age of 5 |
| West Indians | 0.0 /100 | #276 | Tragic 20.6% |
| Immigrants | West Indies | 0.0 /100 | #277 | Tragic 20.7% |
| Immigrants | Grenada | 0.0 /100 | #278 | Tragic 20.7% |
| Sub-Saharan Africans | 0.0 /100 | #279 | Tragic 20.8% |
| French American Indians | 0.0 /100 | #280 | Tragic 20.8% |
| Senegalese | 0.0 /100 | #281 | Tragic 20.9% |
| Potawatomi | 0.0 /100 | #282 | Tragic 21.0% |
| Comanche | 0.0 /100 | #283 | Tragic 21.0% |
| Somalis | 0.0 /100 | #284 | Tragic 21.1% |
| Haitians | 0.0 /100 | #285 | Tragic 21.2% |
| Immigrants | Latin America | 0.0 /100 | #286 | Tragic 21.2% |
| Immigrants | Zaire | 0.0 /100 | #287 | Tragic 21.3% |
| Immigrants | Senegal | 0.0 /100 | #288 | Tragic 21.3% |
| Immigrants | Haiti | 0.0 /100 | #289 | Tragic 21.3% |
| Immigrants | Caribbean | 0.0 /100 | #290 | Tragic 21.4% |