Immigrants from Guyana vs Colombian Child Poverty Under the Age of 16
COMPARE
Immigrants from Guyana
Colombian
Child Poverty Under the Age of 16
Child Poverty Under the Age of 16 Comparison
Immigrants from Guyana
Colombians
19.4%
CHILD POVERTY UNDER THE AGE OF 16
0.1/ 100
METRIC RATING
262nd/ 347
METRIC RANK
15.8%
CHILD POVERTY UNDER THE AGE OF 16
67.6/ 100
METRIC RATING
162nd/ 347
METRIC RANK
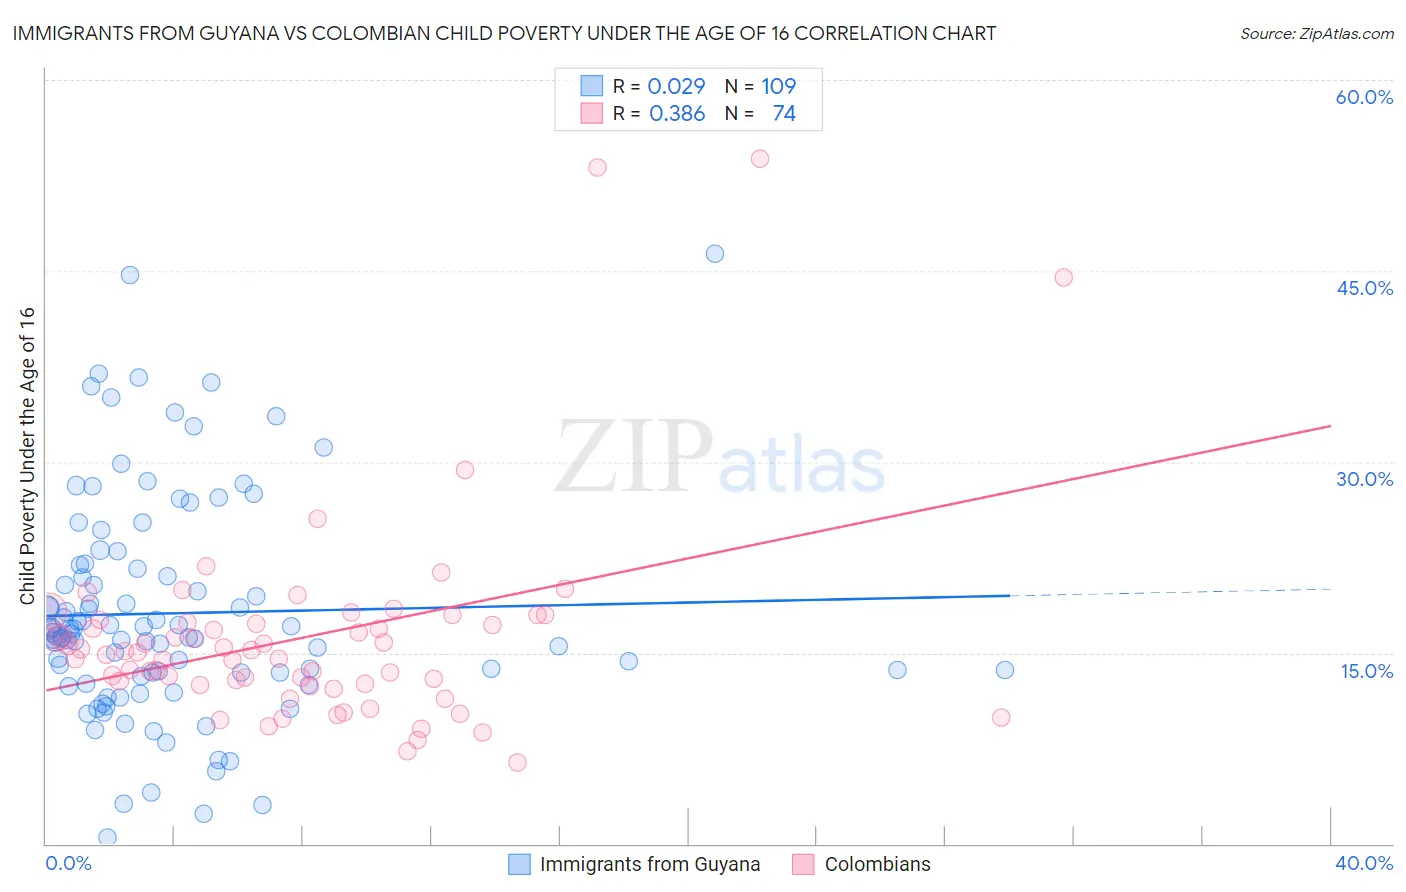
Immigrants from Guyana vs Colombian Child Poverty Under the Age of 16 Correlation Chart
The statistical analysis conducted on geographies consisting of 182,901,367 people shows no correlation between the proportion of Immigrants from Guyana and poverty level among children under the age of 16 in the United States with a correlation coefficient (R) of 0.029 and weighted average of 19.4%. Similarly, the statistical analysis conducted on geographies consisting of 415,703,397 people shows a mild positive correlation between the proportion of Colombians and poverty level among children under the age of 16 in the United States with a correlation coefficient (R) of 0.386 and weighted average of 15.8%, a difference of 22.3%.
Child Poverty Under the Age of 16 Correlation Summary
| Measurement | Immigrants from Guyana | Colombian |
| Minimum | 0.46% | 6.4% |
| Maximum | 46.4% | 53.8% |
| Range | 45.9% | 47.4% |
| Mean | 18.1% | 16.2% |
| Median | 16.5% | 15.1% |
| Interquartile 25% (IQ1) | 13.3% | 12.6% |
| Interquartile 75% (IQ3) | 21.7% | 17.4% |
| Interquartile Range (IQR) | 8.5% | 4.8% |
| Standard Deviation (Sample) | 8.7% | 8.2% |
| Standard Deviation (Population) | 8.6% | 8.1% |
Similar Demographics by Child Poverty Under the Age of 16
Demographics Similar to Immigrants from Guyana by Child Poverty Under the Age of 16
In terms of child poverty under the age of 16, the demographic groups most similar to Immigrants from Guyana are Immigrants from Burma/Myanmar (19.4%, a difference of 0.040%), Guyanese (19.3%, a difference of 0.12%), Mexican American Indian (19.3%, a difference of 0.22%), Vietnamese (19.4%, a difference of 0.32%), and Immigrants from Ecuador (19.4%, a difference of 0.38%).
| Demographics | Rating | Rank | Child Poverty Under the Age of 16 |
| Trinidadians and Tobagonians | 0.2 /100 | #255 | Tragic 19.2% |
| Inupiat | 0.2 /100 | #256 | Tragic 19.2% |
| Ottawa | 0.2 /100 | #257 | Tragic 19.2% |
| Spanish Americans | 0.2 /100 | #258 | Tragic 19.2% |
| Mexican American Indians | 0.2 /100 | #259 | Tragic 19.3% |
| Guyanese | 0.2 /100 | #260 | Tragic 19.3% |
| Immigrants | Burma/Myanmar | 0.1 /100 | #261 | Tragic 19.4% |
| Immigrants | Guyana | 0.1 /100 | #262 | Tragic 19.4% |
| Vietnamese | 0.1 /100 | #263 | Tragic 19.4% |
| Immigrants | Ecuador | 0.1 /100 | #264 | Tragic 19.4% |
| Chickasaw | 0.1 /100 | #265 | Tragic 19.5% |
| Liberians | 0.1 /100 | #266 | Tragic 19.5% |
| Cherokee | 0.1 /100 | #267 | Tragic 19.5% |
| Jamaicans | 0.1 /100 | #268 | Tragic 19.7% |
| Immigrants | El Salvador | 0.1 /100 | #269 | Tragic 19.7% |
Demographics Similar to Colombians by Child Poverty Under the Age of 16
In terms of child poverty under the age of 16, the demographic groups most similar to Colombians are Yugoslavian (15.8%, a difference of 0.0%), Immigrants from Germany (15.8%, a difference of 0.040%), Immigrants from Northern Africa (15.8%, a difference of 0.060%), Guamanian/Chamorro (15.9%, a difference of 0.17%), and Immigrants from Oceania (15.9%, a difference of 0.30%).
| Demographics | Rating | Rank | Child Poverty Under the Age of 16 |
| Syrians | 76.1 /100 | #155 | Good 15.6% |
| Immigrants | Venezuela | 74.9 /100 | #156 | Good 15.7% |
| Immigrants | Nepal | 72.9 /100 | #157 | Good 15.7% |
| Immigrants | Chile | 72.8 /100 | #158 | Good 15.7% |
| Immigrants | Fiji | 71.1 /100 | #159 | Good 15.8% |
| Immigrants | Albania | 70.7 /100 | #160 | Good 15.8% |
| Immigrants | Northern Africa | 68.1 /100 | #161 | Good 15.8% |
| Colombians | 67.6 /100 | #162 | Good 15.8% |
| Yugoslavians | 67.6 /100 | #163 | Good 15.8% |
| Immigrants | Germany | 67.3 /100 | #164 | Good 15.8% |
| Guamanians/Chamorros | 66.4 /100 | #165 | Good 15.9% |
| Immigrants | Oceania | 65.4 /100 | #166 | Good 15.9% |
| Costa Ricans | 61.1 /100 | #167 | Good 16.0% |
| South Americans | 57.9 /100 | #168 | Average 16.0% |
| Uruguayans | 54.7 /100 | #169 | Average 16.1% |