Immigrants from Caribbean vs Colombian Child Poverty Under the Age of 16
COMPARE
Immigrants from Caribbean
Colombian
Child Poverty Under the Age of 16
Child Poverty Under the Age of 16 Comparison
Immigrants from Caribbean
Colombians
20.8%
CHILD POVERTY UNDER THE AGE OF 16
0.0/ 100
METRIC RATING
296th/ 347
METRIC RANK
15.8%
CHILD POVERTY UNDER THE AGE OF 16
67.6/ 100
METRIC RATING
162nd/ 347
METRIC RANK
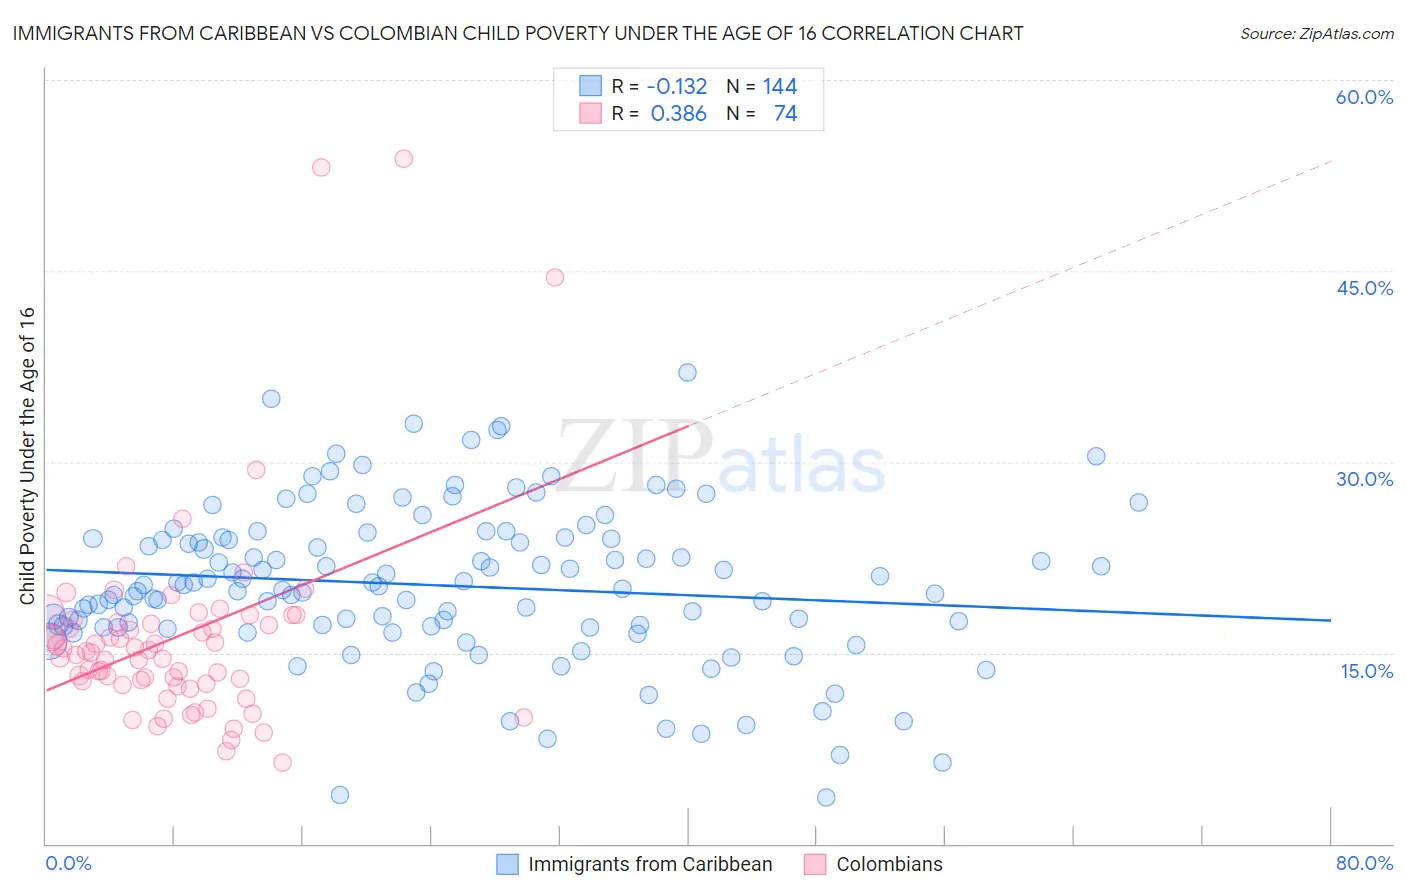
Immigrants from Caribbean vs Colombian Child Poverty Under the Age of 16 Correlation Chart
The statistical analysis conducted on geographies consisting of 444,986,606 people shows a poor negative correlation between the proportion of Immigrants from Caribbean and poverty level among children under the age of 16 in the United States with a correlation coefficient (R) of -0.132 and weighted average of 20.8%. Similarly, the statistical analysis conducted on geographies consisting of 415,703,397 people shows a mild positive correlation between the proportion of Colombians and poverty level among children under the age of 16 in the United States with a correlation coefficient (R) of 0.386 and weighted average of 15.8%, a difference of 31.0%.
Child Poverty Under the Age of 16 Correlation Summary
| Measurement | Immigrants from Caribbean | Colombian |
| Minimum | 3.6% | 6.4% |
| Maximum | 37.0% | 53.8% |
| Range | 33.4% | 47.4% |
| Mean | 20.3% | 16.2% |
| Median | 20.1% | 15.1% |
| Interquartile 25% (IQ1) | 17.0% | 12.6% |
| Interquartile 75% (IQ3) | 24.0% | 17.4% |
| Interquartile Range (IQR) | 6.9% | 4.8% |
| Standard Deviation (Sample) | 6.1% | 8.2% |
| Standard Deviation (Population) | 6.1% | 8.1% |
Similar Demographics by Child Poverty Under the Age of 16
Demographics Similar to Immigrants from Caribbean by Child Poverty Under the Age of 16
In terms of child poverty under the age of 16, the demographic groups most similar to Immigrants from Caribbean are Hispanic or Latino (20.8%, a difference of 0.13%), Arapaho (20.8%, a difference of 0.13%), Mexican (20.7%, a difference of 0.38%), Immigrants from Haiti (20.9%, a difference of 0.43%), and Haitian (20.7%, a difference of 0.52%).
| Demographics | Rating | Rank | Child Poverty Under the Age of 16 |
| Senegalese | 0.0 /100 | #289 | Tragic 20.4% |
| Yaqui | 0.0 /100 | #290 | Tragic 20.4% |
| Chippewa | 0.0 /100 | #291 | Tragic 20.5% |
| Immigrants | Latin America | 0.0 /100 | #292 | Tragic 20.5% |
| Immigrants | Senegal | 0.0 /100 | #293 | Tragic 20.6% |
| Haitians | 0.0 /100 | #294 | Tragic 20.7% |
| Mexicans | 0.0 /100 | #295 | Tragic 20.7% |
| Immigrants | Caribbean | 0.0 /100 | #296 | Tragic 20.8% |
| Hispanics or Latinos | 0.0 /100 | #297 | Tragic 20.8% |
| Arapaho | 0.0 /100 | #298 | Tragic 20.8% |
| Immigrants | Haiti | 0.0 /100 | #299 | Tragic 20.9% |
| Indonesians | 0.0 /100 | #300 | Tragic 21.0% |
| Immigrants | Grenada | 0.0 /100 | #301 | Tragic 21.0% |
| Immigrants | Bahamas | 0.0 /100 | #302 | Tragic 21.0% |
| Choctaw | 0.0 /100 | #303 | Tragic 21.0% |
Demographics Similar to Colombians by Child Poverty Under the Age of 16
In terms of child poverty under the age of 16, the demographic groups most similar to Colombians are Yugoslavian (15.8%, a difference of 0.0%), Immigrants from Germany (15.8%, a difference of 0.040%), Immigrants from Northern Africa (15.8%, a difference of 0.060%), Guamanian/Chamorro (15.9%, a difference of 0.17%), and Immigrants from Oceania (15.9%, a difference of 0.30%).
| Demographics | Rating | Rank | Child Poverty Under the Age of 16 |
| Syrians | 76.1 /100 | #155 | Good 15.6% |
| Immigrants | Venezuela | 74.9 /100 | #156 | Good 15.7% |
| Immigrants | Nepal | 72.9 /100 | #157 | Good 15.7% |
| Immigrants | Chile | 72.8 /100 | #158 | Good 15.7% |
| Immigrants | Fiji | 71.1 /100 | #159 | Good 15.8% |
| Immigrants | Albania | 70.7 /100 | #160 | Good 15.8% |
| Immigrants | Northern Africa | 68.1 /100 | #161 | Good 15.8% |
| Colombians | 67.6 /100 | #162 | Good 15.8% |
| Yugoslavians | 67.6 /100 | #163 | Good 15.8% |
| Immigrants | Germany | 67.3 /100 | #164 | Good 15.8% |
| Guamanians/Chamorros | 66.4 /100 | #165 | Good 15.9% |
| Immigrants | Oceania | 65.4 /100 | #166 | Good 15.9% |
| Costa Ricans | 61.1 /100 | #167 | Good 16.0% |
| South Americans | 57.9 /100 | #168 | Average 16.0% |
| Uruguayans | 54.7 /100 | #169 | Average 16.1% |