Carpatho Rusyn vs Colombian Child Poverty Under the Age of 16
COMPARE
Carpatho Rusyn
Colombian
Child Poverty Under the Age of 16
Child Poverty Under the Age of 16 Comparison
Carpatho Rusyns
Colombians
14.9%
CHILD POVERTY UNDER THE AGE OF 16
93.1/ 100
METRIC RATING
116th/ 347
METRIC RANK
15.8%
CHILD POVERTY UNDER THE AGE OF 16
67.6/ 100
METRIC RATING
162nd/ 347
METRIC RANK
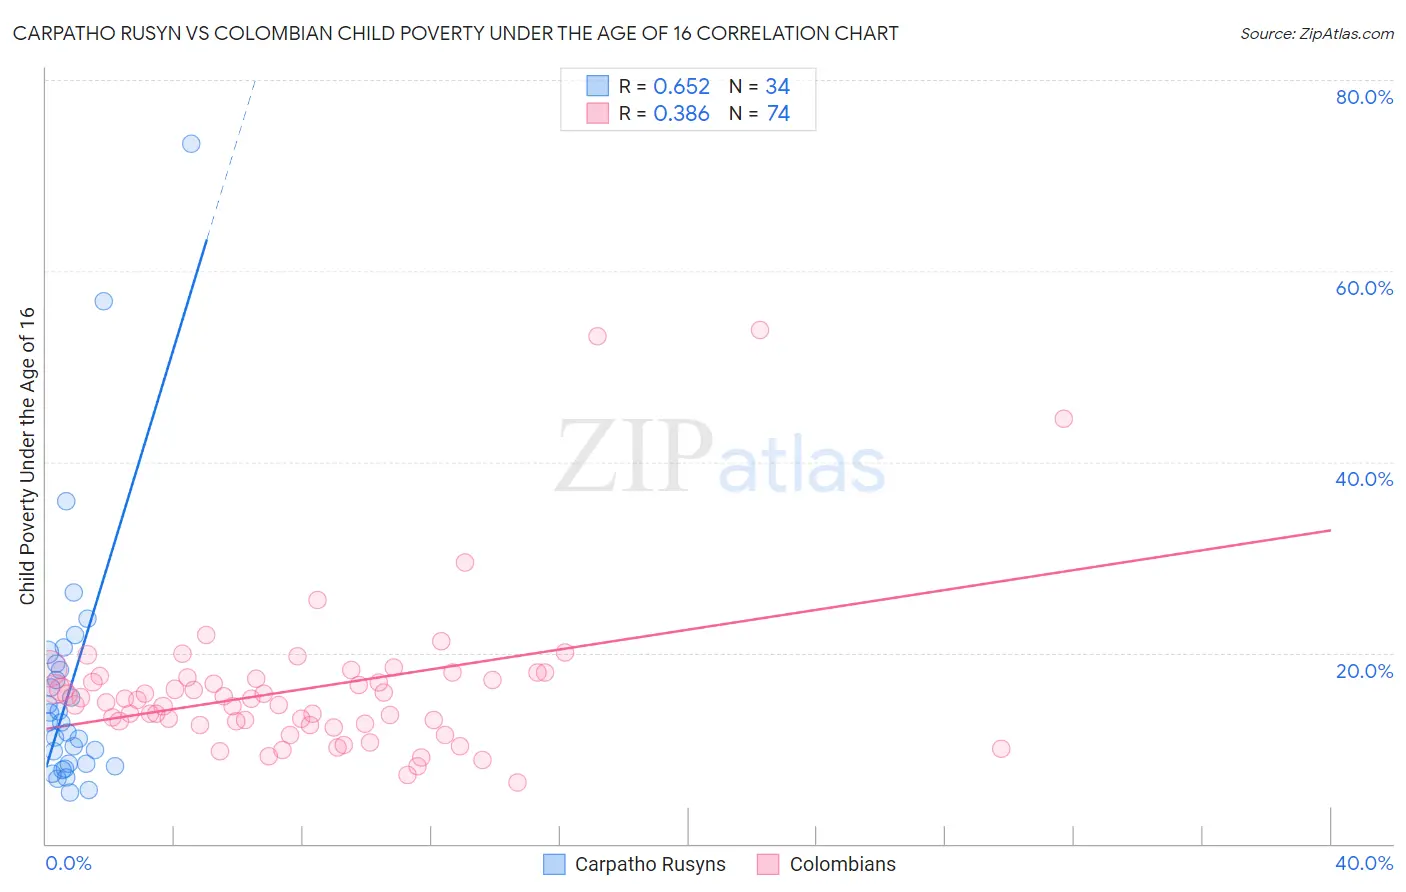
Carpatho Rusyn vs Colombian Child Poverty Under the Age of 16 Correlation Chart
The statistical analysis conducted on geographies consisting of 58,679,406 people shows a significant positive correlation between the proportion of Carpatho Rusyns and poverty level among children under the age of 16 in the United States with a correlation coefficient (R) of 0.652 and weighted average of 14.9%. Similarly, the statistical analysis conducted on geographies consisting of 415,703,397 people shows a mild positive correlation between the proportion of Colombians and poverty level among children under the age of 16 in the United States with a correlation coefficient (R) of 0.386 and weighted average of 15.8%, a difference of 6.0%.
Child Poverty Under the Age of 16 Correlation Summary
| Measurement | Carpatho Rusyn | Colombian |
| Minimum | 5.3% | 6.4% |
| Maximum | 73.3% | 53.8% |
| Range | 68.0% | 47.4% |
| Mean | 16.7% | 16.2% |
| Median | 12.7% | 15.1% |
| Interquartile 25% (IQ1) | 8.4% | 12.6% |
| Interquartile 75% (IQ3) | 18.8% | 17.4% |
| Interquartile Range (IQR) | 10.5% | 4.8% |
| Standard Deviation (Sample) | 14.1% | 8.2% |
| Standard Deviation (Population) | 13.9% | 8.1% |
Similar Demographics by Child Poverty Under the Age of 16
Demographics Similar to Carpatho Rusyns by Child Poverty Under the Age of 16
In terms of child poverty under the age of 16, the demographic groups most similar to Carpatho Rusyns are Immigrants from Ukraine (14.9%, a difference of 0.020%), Sri Lankan (14.9%, a difference of 0.080%), Belgian (14.9%, a difference of 0.11%), Irish (14.9%, a difference of 0.15%), and Immigrants from Norway (15.0%, a difference of 0.15%).
| Demographics | Rating | Rank | Child Poverty Under the Age of 16 |
| Tlingit-Haida | 94.1 /100 | #109 | Exceptional 14.9% |
| English | 93.5 /100 | #110 | Exceptional 14.9% |
| Immigrants | Denmark | 93.5 /100 | #111 | Exceptional 14.9% |
| Irish | 93.4 /100 | #112 | Exceptional 14.9% |
| Belgians | 93.3 /100 | #113 | Exceptional 14.9% |
| Sri Lankans | 93.2 /100 | #114 | Exceptional 14.9% |
| Immigrants | Ukraine | 93.1 /100 | #115 | Exceptional 14.9% |
| Carpatho Rusyns | 93.1 /100 | #116 | Exceptional 14.9% |
| Immigrants | Norway | 92.8 /100 | #117 | Exceptional 15.0% |
| Immigrants | Malaysia | 92.6 /100 | #118 | Exceptional 15.0% |
| Scottish | 92.3 /100 | #119 | Exceptional 15.0% |
| South Africans | 92.1 /100 | #120 | Exceptional 15.0% |
| Immigrants | Zimbabwe | 92.1 /100 | #121 | Exceptional 15.0% |
| Pakistanis | 91.7 /100 | #122 | Exceptional 15.0% |
| Immigrants | Brazil | 91.1 /100 | #123 | Exceptional 15.1% |
Demographics Similar to Colombians by Child Poverty Under the Age of 16
In terms of child poverty under the age of 16, the demographic groups most similar to Colombians are Yugoslavian (15.8%, a difference of 0.0%), Immigrants from Germany (15.8%, a difference of 0.040%), Immigrants from Northern Africa (15.8%, a difference of 0.060%), Guamanian/Chamorro (15.9%, a difference of 0.17%), and Immigrants from Oceania (15.9%, a difference of 0.30%).
| Demographics | Rating | Rank | Child Poverty Under the Age of 16 |
| Syrians | 76.1 /100 | #155 | Good 15.6% |
| Immigrants | Venezuela | 74.9 /100 | #156 | Good 15.7% |
| Immigrants | Nepal | 72.9 /100 | #157 | Good 15.7% |
| Immigrants | Chile | 72.8 /100 | #158 | Good 15.7% |
| Immigrants | Fiji | 71.1 /100 | #159 | Good 15.8% |
| Immigrants | Albania | 70.7 /100 | #160 | Good 15.8% |
| Immigrants | Northern Africa | 68.1 /100 | #161 | Good 15.8% |
| Colombians | 67.6 /100 | #162 | Good 15.8% |
| Yugoslavians | 67.6 /100 | #163 | Good 15.8% |
| Immigrants | Germany | 67.3 /100 | #164 | Good 15.8% |
| Guamanians/Chamorros | 66.4 /100 | #165 | Good 15.9% |
| Immigrants | Oceania | 65.4 /100 | #166 | Good 15.9% |
| Costa Ricans | 61.1 /100 | #167 | Good 16.0% |
| South Americans | 57.9 /100 | #168 | Average 16.0% |
| Uruguayans | 54.7 /100 | #169 | Average 16.1% |