Immigrants from Grenada vs Choctaw Child Poverty Under the Age of 5
COMPARE
Immigrants from Grenada
Choctaw
Child Poverty Under the Age of 5
Child Poverty Under the Age of 5 Comparison
Immigrants from Grenada
Choctaw
20.7%
CHILD POVERTY UNDER THE AGE OF 5
0.0/ 100
METRIC RATING
278th/ 347
METRIC RANK
23.5%
CHILD POVERTY UNDER THE AGE OF 5
0.0/ 100
METRIC RATING
320th/ 347
METRIC RANK
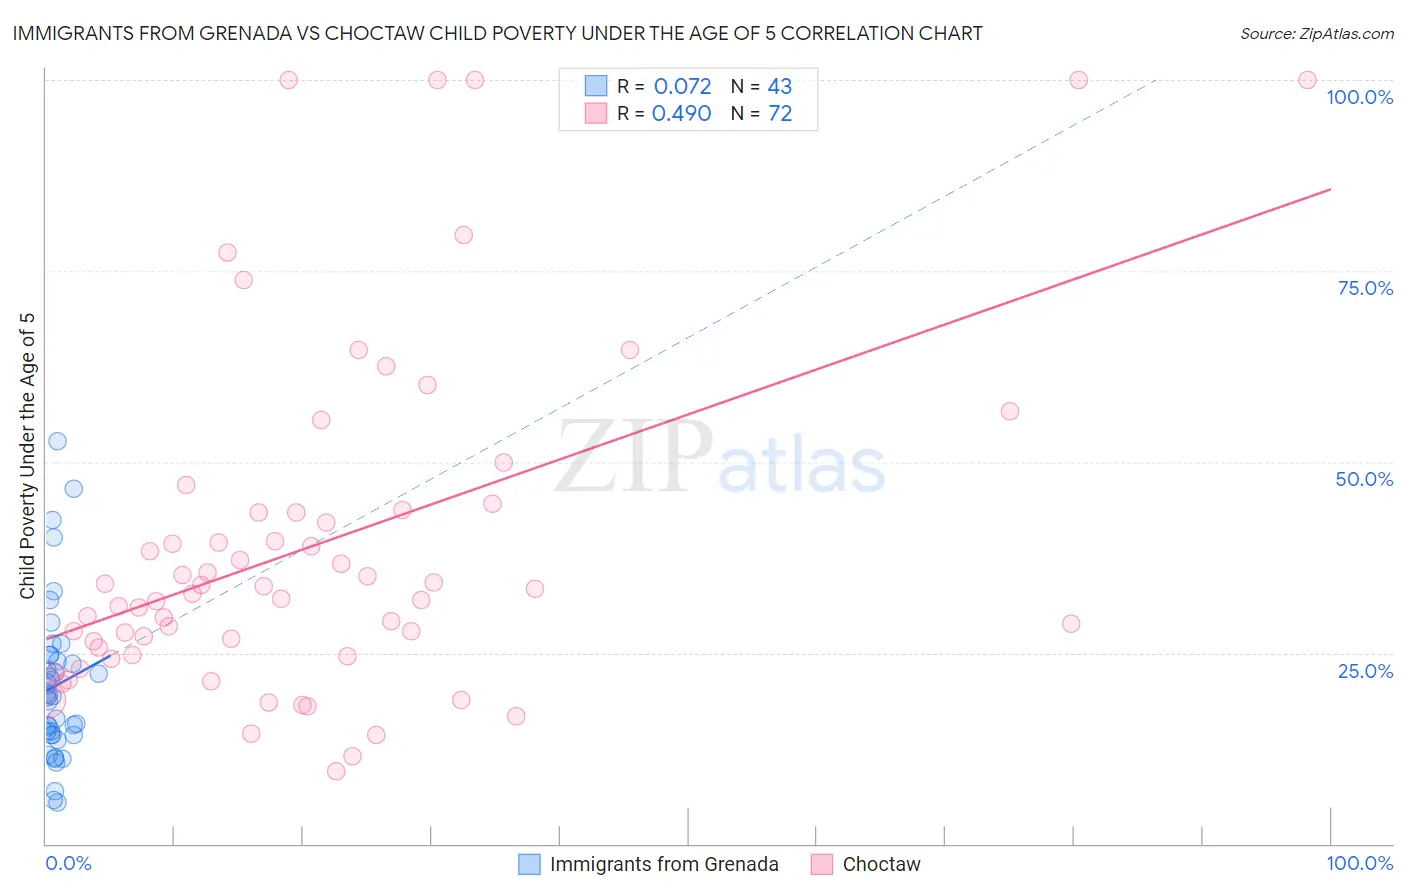
Immigrants from Grenada vs Choctaw Child Poverty Under the Age of 5 Correlation Chart
The statistical analysis conducted on geographies consisting of 66,612,136 people shows a slight positive correlation between the proportion of Immigrants from Grenada and poverty level among children under the age of 5 in the United States with a correlation coefficient (R) of 0.072 and weighted average of 20.7%. Similarly, the statistical analysis conducted on geographies consisting of 264,191,742 people shows a moderate positive correlation between the proportion of Choctaw and poverty level among children under the age of 5 in the United States with a correlation coefficient (R) of 0.490 and weighted average of 23.5%, a difference of 13.6%.
Child Poverty Under the Age of 5 Correlation Summary
| Measurement | Immigrants from Grenada | Choctaw |
| Minimum | 5.4% | 9.5% |
| Maximum | 52.7% | 100.0% |
| Range | 47.3% | 90.5% |
| Mean | 20.7% | 39.2% |
| Median | 19.3% | 33.0% |
| Interquartile 25% (IQ1) | 14.2% | 25.2% |
| Interquartile 75% (IQ3) | 24.7% | 43.5% |
| Interquartile Range (IQR) | 10.5% | 18.3% |
| Standard Deviation (Sample) | 10.3% | 22.4% |
| Standard Deviation (Population) | 10.2% | 22.3% |
Similar Demographics by Child Poverty Under the Age of 5
Demographics Similar to Immigrants from Grenada by Child Poverty Under the Age of 5
In terms of child poverty under the age of 5, the demographic groups most similar to Immigrants from Grenada are Immigrants from West Indies (20.7%, a difference of 0.020%), West Indian (20.6%, a difference of 0.19%), Bangladeshi (20.6%, a difference of 0.28%), Immigrants from Belize (20.6%, a difference of 0.33%), and Subsaharan African (20.8%, a difference of 0.37%).
| Demographics | Rating | Rank | Child Poverty Under the Age of 5 |
| Americans | 0.1 /100 | #271 | Tragic 20.5% |
| Immigrants | Jamaica | 0.1 /100 | #272 | Tragic 20.5% |
| Central Americans | 0.1 /100 | #273 | Tragic 20.6% |
| Immigrants | Belize | 0.1 /100 | #274 | Tragic 20.6% |
| Bangladeshis | 0.1 /100 | #275 | Tragic 20.6% |
| West Indians | 0.0 /100 | #276 | Tragic 20.6% |
| Immigrants | West Indies | 0.0 /100 | #277 | Tragic 20.7% |
| Immigrants | Grenada | 0.0 /100 | #278 | Tragic 20.7% |
| Sub-Saharan Africans | 0.0 /100 | #279 | Tragic 20.8% |
| French American Indians | 0.0 /100 | #280 | Tragic 20.8% |
| Senegalese | 0.0 /100 | #281 | Tragic 20.9% |
| Potawatomi | 0.0 /100 | #282 | Tragic 21.0% |
| Comanche | 0.0 /100 | #283 | Tragic 21.0% |
| Somalis | 0.0 /100 | #284 | Tragic 21.1% |
| Haitians | 0.0 /100 | #285 | Tragic 21.2% |
Demographics Similar to Choctaw by Child Poverty Under the Age of 5
In terms of child poverty under the age of 5, the demographic groups most similar to Choctaw are Immigrants from Honduras (23.5%, a difference of 0.030%), Ute (23.5%, a difference of 0.26%), Chippewa (23.4%, a difference of 0.38%), Pueblo (23.7%, a difference of 0.84%), and Dutch West Indian (23.3%, a difference of 0.86%).
| Demographics | Rating | Rank | Child Poverty Under the Age of 5 |
| Bahamians | 0.0 /100 | #313 | Tragic 23.0% |
| U.S. Virgin Islanders | 0.0 /100 | #314 | Tragic 23.0% |
| Arapaho | 0.0 /100 | #315 | Tragic 23.1% |
| Yakama | 0.0 /100 | #316 | Tragic 23.1% |
| Menominee | 0.0 /100 | #317 | Tragic 23.3% |
| Dutch West Indians | 0.0 /100 | #318 | Tragic 23.3% |
| Chippewa | 0.0 /100 | #319 | Tragic 23.4% |
| Choctaw | 0.0 /100 | #320 | Tragic 23.5% |
| Immigrants | Honduras | 0.0 /100 | #321 | Tragic 23.5% |
| Ute | 0.0 /100 | #322 | Tragic 23.5% |
| Pueblo | 0.0 /100 | #323 | Tragic 23.7% |
| Paiute | 0.0 /100 | #324 | Tragic 23.8% |
| Immigrants | Congo | 0.0 /100 | #325 | Tragic 23.9% |
| Central American Indians | 0.0 /100 | #326 | Tragic 23.9% |
| Dominicans | 0.0 /100 | #327 | Tragic 24.0% |