Immigrants from Trinidad and Tobago vs Choctaw Child Poverty Under the Age of 5
COMPARE
Immigrants from Trinidad and Tobago
Choctaw
Child Poverty Under the Age of 5
Child Poverty Under the Age of 5 Comparison
Immigrants from Trinidad and Tobago
Choctaw
19.4%
CHILD POVERTY UNDER THE AGE OF 5
0.8/ 100
METRIC RATING
236th/ 347
METRIC RANK
23.5%
CHILD POVERTY UNDER THE AGE OF 5
0.0/ 100
METRIC RATING
320th/ 347
METRIC RANK
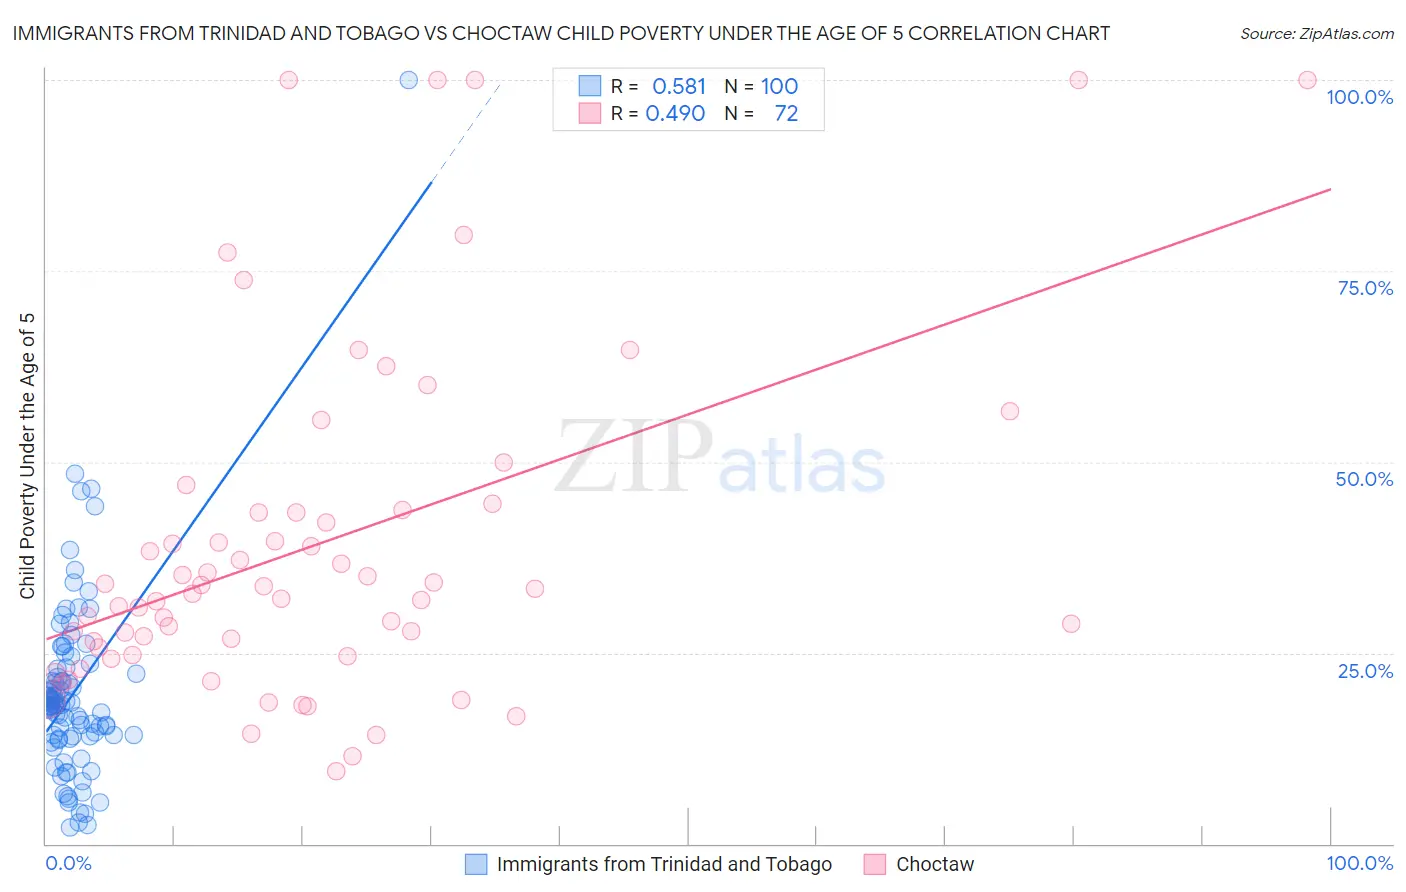
Immigrants from Trinidad and Tobago vs Choctaw Child Poverty Under the Age of 5 Correlation Chart
The statistical analysis conducted on geographies consisting of 218,090,061 people shows a substantial positive correlation between the proportion of Immigrants from Trinidad and Tobago and poverty level among children under the age of 5 in the United States with a correlation coefficient (R) of 0.581 and weighted average of 19.4%. Similarly, the statistical analysis conducted on geographies consisting of 264,191,742 people shows a moderate positive correlation between the proportion of Choctaw and poverty level among children under the age of 5 in the United States with a correlation coefficient (R) of 0.490 and weighted average of 23.5%, a difference of 21.1%.
Child Poverty Under the Age of 5 Correlation Summary
| Measurement | Immigrants from Trinidad and Tobago | Choctaw |
| Minimum | 2.2% | 9.5% |
| Maximum | 100.0% | 100.0% |
| Range | 97.8% | 90.5% |
| Mean | 19.7% | 39.2% |
| Median | 18.1% | 33.0% |
| Interquartile 25% (IQ1) | 14.1% | 25.2% |
| Interquartile 75% (IQ3) | 22.6% | 43.5% |
| Interquartile Range (IQR) | 8.5% | 18.3% |
| Standard Deviation (Sample) | 12.4% | 22.4% |
| Standard Deviation (Population) | 12.3% | 22.3% |
Similar Demographics by Child Poverty Under the Age of 5
Demographics Similar to Immigrants from Trinidad and Tobago by Child Poverty Under the Age of 5
In terms of child poverty under the age of 5, the demographic groups most similar to Immigrants from Trinidad and Tobago are Immigrants from Laos (19.4%, a difference of 0.0%), Immigrants from Micronesia (19.4%, a difference of 0.21%), Sudanese (19.3%, a difference of 0.34%), Trinidadian and Tobagonian (19.3%, a difference of 0.39%), and Immigrants from Cabo Verde (19.5%, a difference of 0.55%).
| Demographics | Rating | Rank | Child Poverty Under the Age of 5 |
| Ghanaians | 1.2 /100 | #229 | Tragic 19.2% |
| Ecuadorians | 1.2 /100 | #230 | Tragic 19.2% |
| Bermudans | 1.2 /100 | #231 | Tragic 19.2% |
| Trinidadians and Tobagonians | 0.9 /100 | #232 | Tragic 19.3% |
| Sudanese | 0.9 /100 | #233 | Tragic 19.3% |
| Immigrants | Micronesia | 0.9 /100 | #234 | Tragic 19.4% |
| Immigrants | Laos | 0.8 /100 | #235 | Tragic 19.4% |
| Immigrants | Trinidad and Tobago | 0.8 /100 | #236 | Tragic 19.4% |
| Immigrants | Cabo Verde | 0.6 /100 | #237 | Tragic 19.5% |
| Salvadorans | 0.6 /100 | #238 | Tragic 19.5% |
| Vietnamese | 0.6 /100 | #239 | Tragic 19.5% |
| Immigrants | Ecuador | 0.5 /100 | #240 | Tragic 19.6% |
| Alaska Natives | 0.5 /100 | #241 | Tragic 19.6% |
| Immigrants | Guyana | 0.5 /100 | #242 | Tragic 19.6% |
| Osage | 0.5 /100 | #243 | Tragic 19.6% |
Demographics Similar to Choctaw by Child Poverty Under the Age of 5
In terms of child poverty under the age of 5, the demographic groups most similar to Choctaw are Immigrants from Honduras (23.5%, a difference of 0.030%), Ute (23.5%, a difference of 0.26%), Chippewa (23.4%, a difference of 0.38%), Pueblo (23.7%, a difference of 0.84%), and Dutch West Indian (23.3%, a difference of 0.86%).
| Demographics | Rating | Rank | Child Poverty Under the Age of 5 |
| Bahamians | 0.0 /100 | #313 | Tragic 23.0% |
| U.S. Virgin Islanders | 0.0 /100 | #314 | Tragic 23.0% |
| Arapaho | 0.0 /100 | #315 | Tragic 23.1% |
| Yakama | 0.0 /100 | #316 | Tragic 23.1% |
| Menominee | 0.0 /100 | #317 | Tragic 23.3% |
| Dutch West Indians | 0.0 /100 | #318 | Tragic 23.3% |
| Chippewa | 0.0 /100 | #319 | Tragic 23.4% |
| Choctaw | 0.0 /100 | #320 | Tragic 23.5% |
| Immigrants | Honduras | 0.0 /100 | #321 | Tragic 23.5% |
| Ute | 0.0 /100 | #322 | Tragic 23.5% |
| Pueblo | 0.0 /100 | #323 | Tragic 23.7% |
| Paiute | 0.0 /100 | #324 | Tragic 23.8% |
| Immigrants | Congo | 0.0 /100 | #325 | Tragic 23.9% |
| Central American Indians | 0.0 /100 | #326 | Tragic 23.9% |
| Dominicans | 0.0 /100 | #327 | Tragic 24.0% |