Immigrants from Grenada vs Immigrants from Colombia Child Poverty Under the Age of 5
COMPARE
Immigrants from Grenada
Immigrants from Colombia
Child Poverty Under the Age of 5
Child Poverty Under the Age of 5 Comparison
Immigrants from Grenada
Immigrants from Colombia
20.7%
CHILD POVERTY UNDER THE AGE OF 5
0.0/ 100
METRIC RATING
278th/ 347
METRIC RANK
16.9%
CHILD POVERTY UNDER THE AGE OF 5
66.9/ 100
METRIC RATING
165th/ 347
METRIC RANK
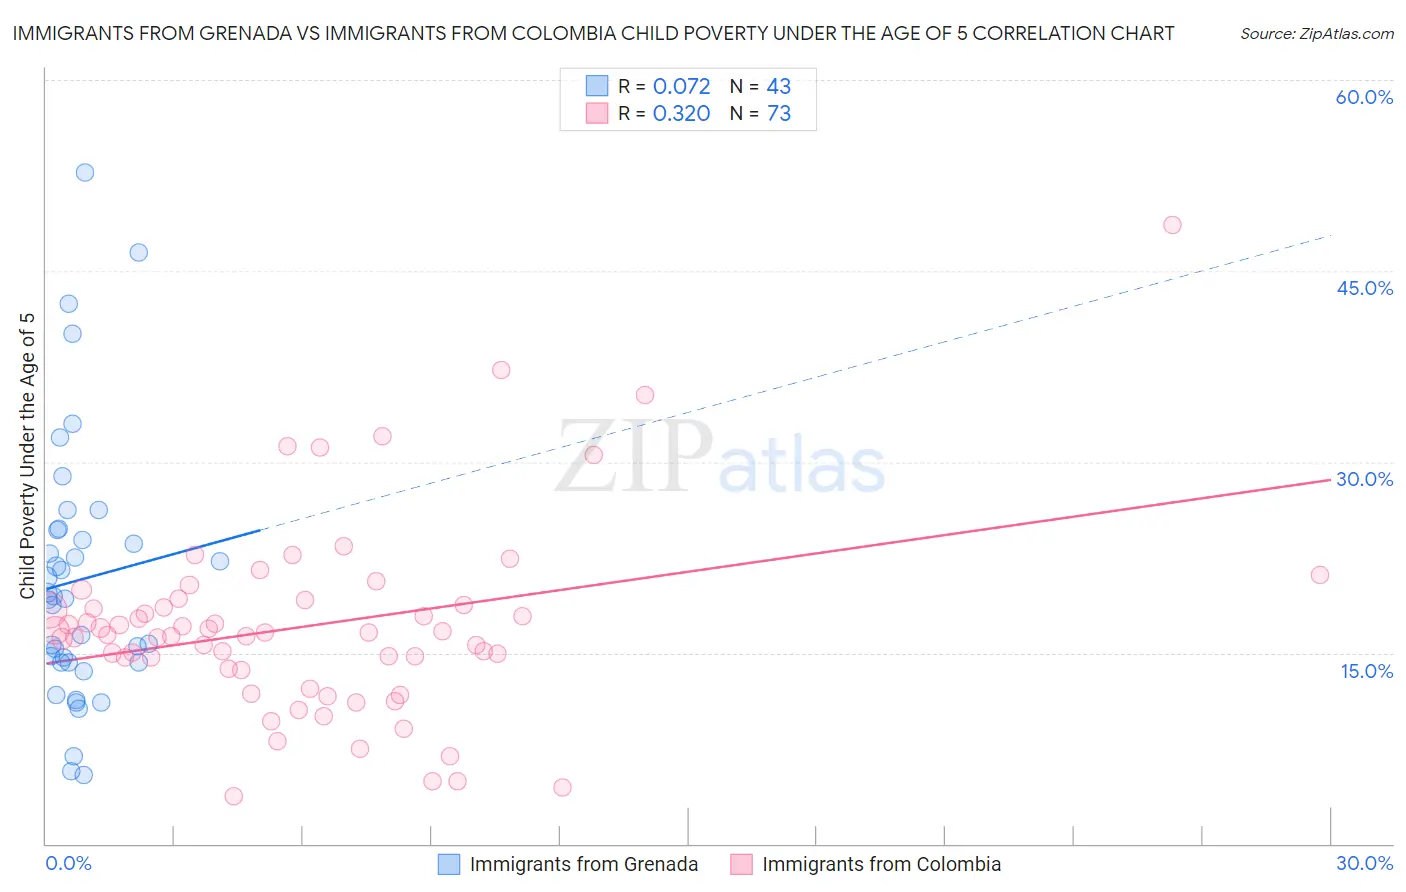
Immigrants from Grenada vs Immigrants from Colombia Child Poverty Under the Age of 5 Correlation Chart
The statistical analysis conducted on geographies consisting of 66,612,136 people shows a slight positive correlation between the proportion of Immigrants from Grenada and poverty level among children under the age of 5 in the United States with a correlation coefficient (R) of 0.072 and weighted average of 20.7%. Similarly, the statistical analysis conducted on geographies consisting of 364,956,826 people shows a mild positive correlation between the proportion of Immigrants from Colombia and poverty level among children under the age of 5 in the United States with a correlation coefficient (R) of 0.320 and weighted average of 16.9%, a difference of 22.3%.
Child Poverty Under the Age of 5 Correlation Summary
| Measurement | Immigrants from Grenada | Immigrants from Colombia |
| Minimum | 5.4% | 3.7% |
| Maximum | 52.7% | 48.6% |
| Range | 47.3% | 44.9% |
| Mean | 20.7% | 17.1% |
| Median | 19.3% | 16.6% |
| Interquartile 25% (IQ1) | 14.2% | 13.7% |
| Interquartile 75% (IQ3) | 24.7% | 19.0% |
| Interquartile Range (IQR) | 10.5% | 5.3% |
| Standard Deviation (Sample) | 10.3% | 7.6% |
| Standard Deviation (Population) | 10.2% | 7.5% |
Similar Demographics by Child Poverty Under the Age of 5
Demographics Similar to Immigrants from Grenada by Child Poverty Under the Age of 5
In terms of child poverty under the age of 5, the demographic groups most similar to Immigrants from Grenada are Immigrants from West Indies (20.7%, a difference of 0.020%), West Indian (20.6%, a difference of 0.19%), Bangladeshi (20.6%, a difference of 0.28%), Immigrants from Belize (20.6%, a difference of 0.33%), and Subsaharan African (20.8%, a difference of 0.37%).
| Demographics | Rating | Rank | Child Poverty Under the Age of 5 |
| Americans | 0.1 /100 | #271 | Tragic 20.5% |
| Immigrants | Jamaica | 0.1 /100 | #272 | Tragic 20.5% |
| Central Americans | 0.1 /100 | #273 | Tragic 20.6% |
| Immigrants | Belize | 0.1 /100 | #274 | Tragic 20.6% |
| Bangladeshis | 0.1 /100 | #275 | Tragic 20.6% |
| West Indians | 0.0 /100 | #276 | Tragic 20.6% |
| Immigrants | West Indies | 0.0 /100 | #277 | Tragic 20.7% |
| Immigrants | Grenada | 0.0 /100 | #278 | Tragic 20.7% |
| Sub-Saharan Africans | 0.0 /100 | #279 | Tragic 20.8% |
| French American Indians | 0.0 /100 | #280 | Tragic 20.8% |
| Senegalese | 0.0 /100 | #281 | Tragic 20.9% |
| Potawatomi | 0.0 /100 | #282 | Tragic 21.0% |
| Comanche | 0.0 /100 | #283 | Tragic 21.0% |
| Somalis | 0.0 /100 | #284 | Tragic 21.1% |
| Haitians | 0.0 /100 | #285 | Tragic 21.2% |
Demographics Similar to Immigrants from Colombia by Child Poverty Under the Age of 5
In terms of child poverty under the age of 5, the demographic groups most similar to Immigrants from Colombia are Immigrants from Oceania (16.9%, a difference of 0.090%), Scottish (16.9%, a difference of 0.21%), Slavic (17.0%, a difference of 0.34%), Costa Rican (16.9%, a difference of 0.36%), and English (16.8%, a difference of 0.43%).
| Demographics | Rating | Rank | Child Poverty Under the Age of 5 |
| Czechoslovakians | 72.5 /100 | #158 | Good 16.8% |
| Immigrants | Syria | 72.3 /100 | #159 | Good 16.8% |
| Irish | 72.0 /100 | #160 | Good 16.8% |
| English | 70.4 /100 | #161 | Good 16.8% |
| Costa Ricans | 69.8 /100 | #162 | Good 16.9% |
| Scottish | 68.6 /100 | #163 | Good 16.9% |
| Immigrants | Oceania | 67.6 /100 | #164 | Good 16.9% |
| Immigrants | Colombia | 66.9 /100 | #165 | Good 16.9% |
| Slavs | 64.0 /100 | #166 | Good 17.0% |
| Immigrants | Uzbekistan | 62.0 /100 | #167 | Good 17.0% |
| Uruguayans | 60.5 /100 | #168 | Good 17.0% |
| Immigrants | South America | 60.0 /100 | #169 | Good 17.1% |
| Immigrants | Western Asia | 59.2 /100 | #170 | Average 17.1% |
| Immigrants | Morocco | 58.9 /100 | #171 | Average 17.1% |
| Yugoslavians | 54.1 /100 | #172 | Average 17.2% |