Immigrants from Venezuela vs Uruguayan Female Poverty Among 25-34 Year Olds
COMPARE
Immigrants from Venezuela
Uruguayan
Female Poverty Among 25-34 Year Olds
Female Poverty Among 25-34 Year Olds Comparison
Immigrants from Venezuela
Uruguayans
13.6%
FEMALE POVERTY AMONG 25-34 YEAR OLDS
40.7/ 100
METRIC RATING
182nd/ 347
METRIC RANK
13.3%
FEMALE POVERTY AMONG 25-34 YEAR OLDS
66.9/ 100
METRIC RATING
159th/ 347
METRIC RANK
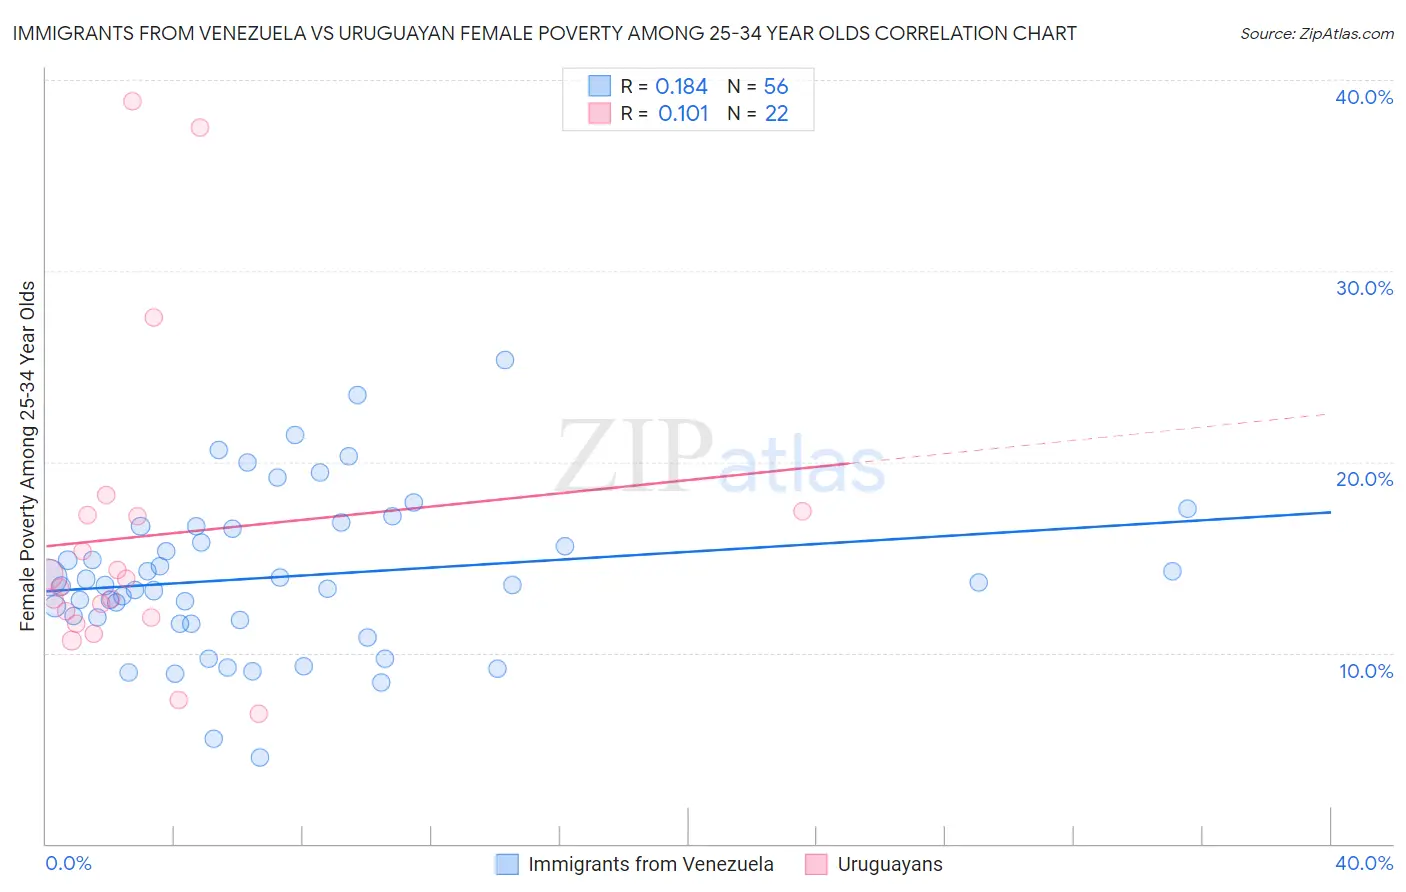
Immigrants from Venezuela vs Uruguayan Female Poverty Among 25-34 Year Olds Correlation Chart
The statistical analysis conducted on geographies consisting of 285,242,429 people shows a poor positive correlation between the proportion of Immigrants from Venezuela and poverty level among females between the ages 25 and 34 in the United States with a correlation coefficient (R) of 0.184 and weighted average of 13.6%. Similarly, the statistical analysis conducted on geographies consisting of 143,910,872 people shows a poor positive correlation between the proportion of Uruguayans and poverty level among females between the ages 25 and 34 in the United States with a correlation coefficient (R) of 0.101 and weighted average of 13.3%, a difference of 2.3%.
Female Poverty Among 25-34 Year Olds Correlation Summary
| Measurement | Immigrants from Venezuela | Uruguayan |
| Minimum | 4.5% | 6.8% |
| Maximum | 25.3% | 38.9% |
| Range | 20.8% | 32.1% |
| Mean | 14.0% | 16.1% |
| Median | 13.5% | 13.7% |
| Interquartile 25% (IQ1) | 11.6% | 11.8% |
| Interquartile 75% (IQ3) | 16.6% | 17.2% |
| Interquartile Range (IQR) | 4.9% | 5.4% |
| Standard Deviation (Sample) | 4.2% | 8.3% |
| Standard Deviation (Population) | 4.1% | 8.1% |
Similar Demographics by Female Poverty Among 25-34 Year Olds
Demographics Similar to Immigrants from Venezuela by Female Poverty Among 25-34 Year Olds
In terms of female poverty among 25-34 year olds, the demographic groups most similar to Immigrants from Venezuela are Portuguese (13.6%, a difference of 0.030%), German (13.6%, a difference of 0.070%), Guamanian/Chamorro (13.6%, a difference of 0.070%), Immigrants from Eastern Africa (13.6%, a difference of 0.24%), and Canadian (13.6%, a difference of 0.30%).
| Demographics | Rating | Rank | Female Poverty Among 25-34 Year Olds |
| Bermudans | 46.8 /100 | #175 | Average 13.6% |
| Yugoslavians | 45.0 /100 | #176 | Average 13.6% |
| Venezuelans | 44.6 /100 | #177 | Average 13.6% |
| Canadians | 44.3 /100 | #178 | Average 13.6% |
| Immigrants | Eastern Africa | 43.6 /100 | #179 | Average 13.6% |
| Germans | 41.6 /100 | #180 | Average 13.6% |
| Guamanians/Chamorros | 41.5 /100 | #181 | Average 13.6% |
| Immigrants | Venezuela | 40.7 /100 | #182 | Average 13.6% |
| Portuguese | 40.3 /100 | #183 | Average 13.6% |
| Czechoslovakians | 36.8 /100 | #184 | Fair 13.7% |
| Irish | 35.3 /100 | #185 | Fair 13.7% |
| Immigrants | Uruguay | 34.1 /100 | #186 | Fair 13.7% |
| Slovaks | 34.1 /100 | #187 | Fair 13.7% |
| Immigrants | Eritrea | 32.7 /100 | #188 | Fair 13.7% |
| Finns | 32.5 /100 | #189 | Fair 13.7% |
Demographics Similar to Uruguayans by Female Poverty Among 25-34 Year Olds
In terms of female poverty among 25-34 year olds, the demographic groups most similar to Uruguayans are Immigrants from South America (13.3%, a difference of 0.050%), Icelander (13.3%, a difference of 0.12%), Immigrants from Colombia (13.3%, a difference of 0.22%), Ugandan (13.4%, a difference of 0.26%), and British (13.4%, a difference of 0.32%).
| Demographics | Rating | Rank | Female Poverty Among 25-34 Year Olds |
| Slavs | 75.7 /100 | #152 | Good 13.2% |
| Northern Europeans | 73.7 /100 | #153 | Good 13.2% |
| Arabs | 73.5 /100 | #154 | Good 13.2% |
| Immigrants | Sierra Leone | 72.9 /100 | #155 | Good 13.3% |
| Immigrants | Cameroon | 72.0 /100 | #156 | Good 13.3% |
| Immigrants | Western Europe | 70.3 /100 | #157 | Good 13.3% |
| Immigrants | Colombia | 69.2 /100 | #158 | Good 13.3% |
| Uruguayans | 66.9 /100 | #159 | Good 13.3% |
| Immigrants | South America | 66.3 /100 | #160 | Good 13.3% |
| Icelanders | 65.7 /100 | #161 | Good 13.3% |
| Ugandans | 64.1 /100 | #162 | Good 13.4% |
| British | 63.5 /100 | #163 | Good 13.4% |
| Swiss | 61.7 /100 | #164 | Good 13.4% |
| Basques | 59.3 /100 | #165 | Average 13.4% |
| Belgians | 58.9 /100 | #166 | Average 13.4% |