Immigrants from Germany vs Immigrants from Uganda Child Poverty Under the Age of 5
COMPARE
Immigrants from Germany
Immigrants from Uganda
Child Poverty Under the Age of 5
Child Poverty Under the Age of 5 Comparison
Immigrants from Germany
Immigrants from Uganda
17.4%
CHILD POVERTY UNDER THE AGE OF 5
41.0/ 100
METRIC RATING
181st/ 347
METRIC RANK
17.7%
CHILD POVERTY UNDER THE AGE OF 5
25.0/ 100
METRIC RATING
193rd/ 347
METRIC RANK
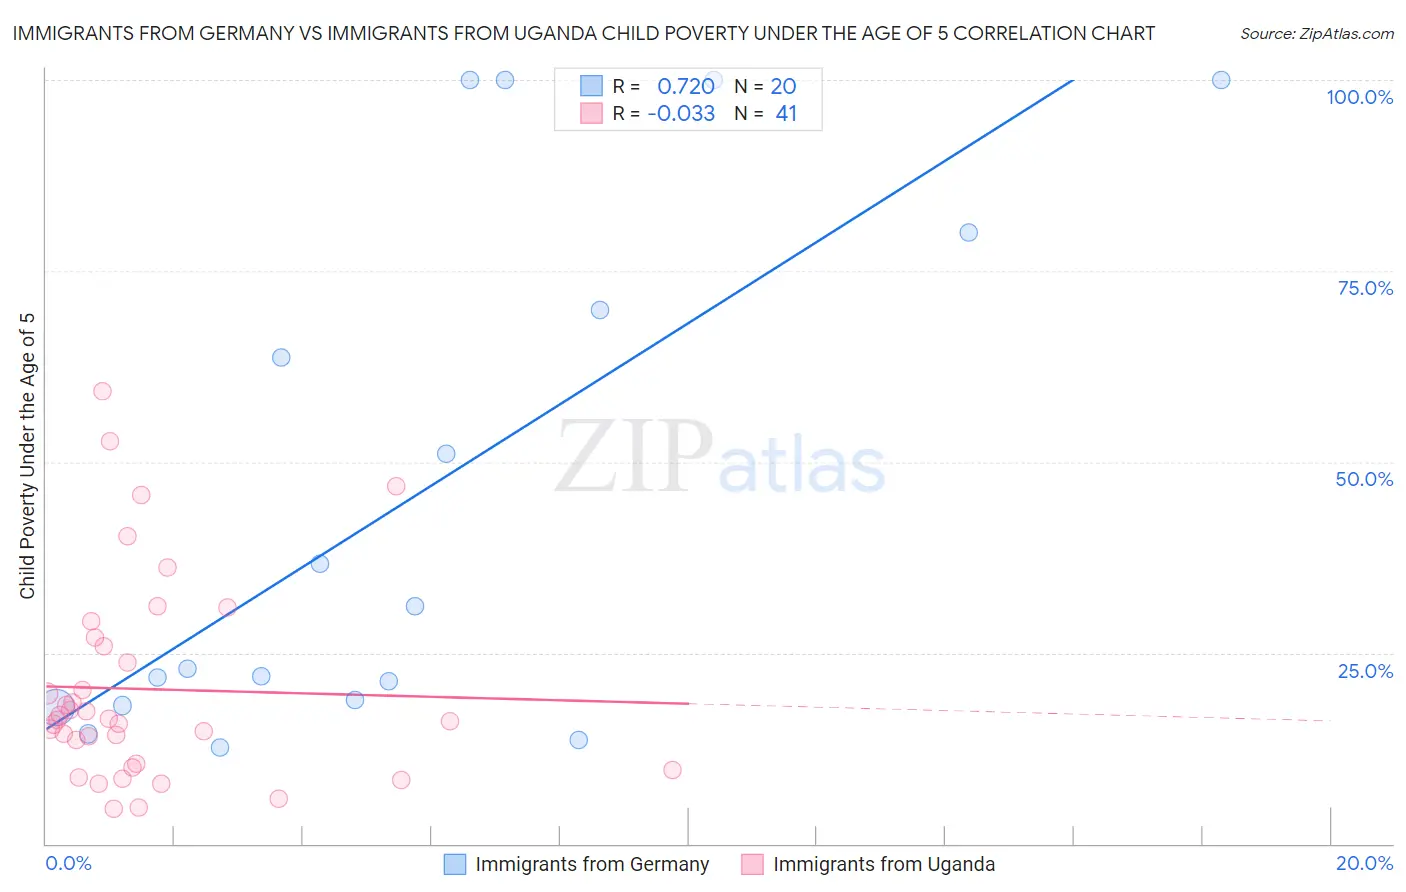
Immigrants from Germany vs Immigrants from Uganda Child Poverty Under the Age of 5 Correlation Chart
The statistical analysis conducted on geographies consisting of 440,983,234 people shows a strong positive correlation between the proportion of Immigrants from Germany and poverty level among children under the age of 5 in the United States with a correlation coefficient (R) of 0.720 and weighted average of 17.4%. Similarly, the statistical analysis conducted on geographies consisting of 124,022,230 people shows no correlation between the proportion of Immigrants from Uganda and poverty level among children under the age of 5 in the United States with a correlation coefficient (R) of -0.033 and weighted average of 17.7%, a difference of 1.9%.
Child Poverty Under the Age of 5 Correlation Summary
| Measurement | Immigrants from Germany | Immigrants from Uganda |
| Minimum | 12.7% | 4.6% |
| Maximum | 100.0% | 59.2% |
| Range | 87.3% | 54.6% |
| Mean | 45.8% | 20.2% |
| Median | 27.0% | 16.2% |
| Interquartile 25% (IQ1) | 18.5% | 10.2% |
| Interquartile 75% (IQ3) | 74.9% | 26.4% |
| Interquartile Range (IQR) | 56.4% | 16.1% |
| Standard Deviation (Sample) | 33.9% | 13.3% |
| Standard Deviation (Population) | 33.0% | 13.1% |
Demographics Similar to Immigrants from Germany and Immigrants from Uganda by Child Poverty Under the Age of 5
In terms of child poverty under the age of 5, the demographic groups most similar to Immigrants from Germany are Arab (17.4%, a difference of 0.030%), Hawaiian (17.4%, a difference of 0.050%), South American Indian (17.4%, a difference of 0.050%), Lebanese (17.4%, a difference of 0.070%), and Immigrants from Cameroon (17.4%, a difference of 0.18%). Similarly, the demographic groups most similar to Immigrants from Uganda are French Canadian (17.7%, a difference of 0.060%), Sierra Leonean (17.7%, a difference of 0.12%), Immigrants from Afghanistan (17.7%, a difference of 0.37%), Immigrants from Uruguay (17.7%, a difference of 0.37%), and Immigrants from Portugal (17.8%, a difference of 0.39%).
| Demographics | Rating | Rank | Child Poverty Under the Age of 5 |
| Immigrants | Sierra Leone | 43.6 /100 | #177 | Average 17.3% |
| Immigrants | Cameroon | 42.7 /100 | #178 | Average 17.4% |
| Hawaiians | 41.5 /100 | #179 | Average 17.4% |
| South American Indians | 41.4 /100 | #180 | Average 17.4% |
| Immigrants | Germany | 41.0 /100 | #181 | Average 17.4% |
| Arabs | 40.7 /100 | #182 | Average 17.4% |
| Lebanese | 40.3 /100 | #183 | Average 17.4% |
| Immigrants | Costa Rica | 39.0 /100 | #184 | Fair 17.4% |
| Immigrants | Armenia | 38.0 /100 | #185 | Fair 17.5% |
| Immigrants | Bosnia and Herzegovina | 35.0 /100 | #186 | Fair 17.5% |
| Kenyans | 34.7 /100 | #187 | Fair 17.5% |
| Carpatho Rusyns | 33.6 /100 | #188 | Fair 17.5% |
| French | 33.6 /100 | #189 | Fair 17.5% |
| Slovaks | 29.2 /100 | #190 | Fair 17.6% |
| Immigrants | Afghanistan | 27.9 /100 | #191 | Fair 17.7% |
| Immigrants | Uruguay | 27.8 /100 | #192 | Fair 17.7% |
| Immigrants | Uganda | 25.0 /100 | #193 | Fair 17.7% |
| French Canadians | 24.6 /100 | #194 | Fair 17.7% |
| Sierra Leoneans | 24.1 /100 | #195 | Fair 17.7% |
| Immigrants | Portugal | 22.2 /100 | #196 | Fair 17.8% |
| Immigrants | Kenya | 20.0 /100 | #197 | Fair 17.9% |