Immigrants from Germany vs Houma Child Poverty Under the Age of 5
COMPARE
Immigrants from Germany
Houma
Child Poverty Under the Age of 5
Child Poverty Under the Age of 5 Comparison
Immigrants from Germany
Houma
17.4%
CHILD POVERTY UNDER THE AGE OF 5
41.0/ 100
METRIC RATING
181st/ 347
METRIC RANK
22.7%
CHILD POVERTY UNDER THE AGE OF 5
0.0/ 100
METRIC RATING
309th/ 347
METRIC RANK
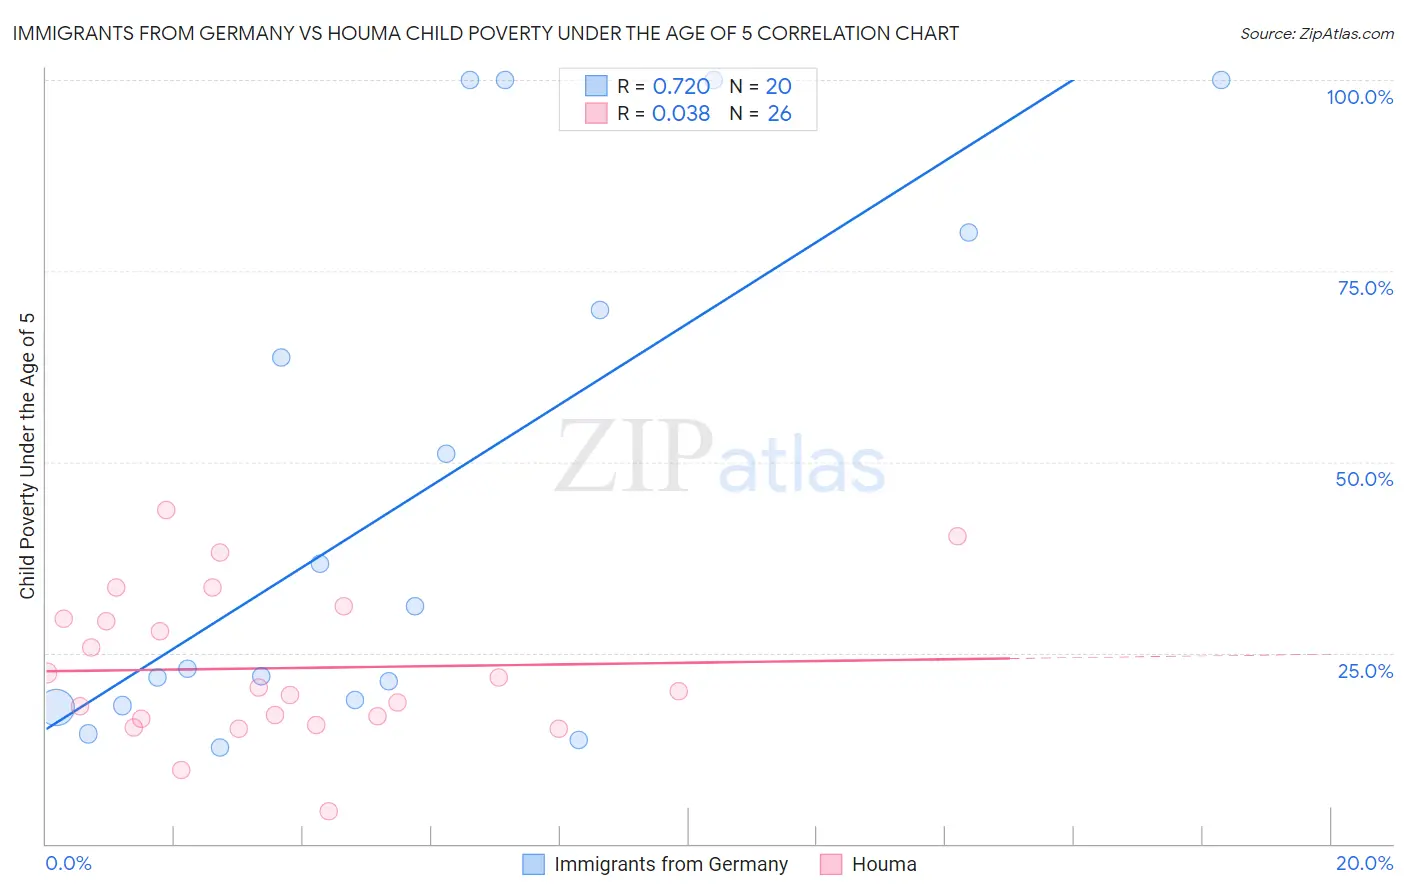
Immigrants from Germany vs Houma Child Poverty Under the Age of 5 Correlation Chart
The statistical analysis conducted on geographies consisting of 440,983,234 people shows a strong positive correlation between the proportion of Immigrants from Germany and poverty level among children under the age of 5 in the United States with a correlation coefficient (R) of 0.720 and weighted average of 17.4%. Similarly, the statistical analysis conducted on geographies consisting of 36,619,572 people shows no correlation between the proportion of Houma and poverty level among children under the age of 5 in the United States with a correlation coefficient (R) of 0.038 and weighted average of 22.7%, a difference of 30.6%.
Child Poverty Under the Age of 5 Correlation Summary
| Measurement | Immigrants from Germany | Houma |
| Minimum | 12.7% | 4.3% |
| Maximum | 100.0% | 43.6% |
| Range | 87.3% | 39.3% |
| Mean | 45.8% | 23.0% |
| Median | 27.0% | 20.3% |
| Interquartile 25% (IQ1) | 18.5% | 16.3% |
| Interquartile 75% (IQ3) | 74.9% | 29.4% |
| Interquartile Range (IQR) | 56.4% | 13.1% |
| Standard Deviation (Sample) | 33.9% | 9.6% |
| Standard Deviation (Population) | 33.0% | 9.4% |
Similar Demographics by Child Poverty Under the Age of 5
Demographics Similar to Immigrants from Germany by Child Poverty Under the Age of 5
In terms of child poverty under the age of 5, the demographic groups most similar to Immigrants from Germany are Arab (17.4%, a difference of 0.030%), Hawaiian (17.4%, a difference of 0.050%), South American Indian (17.4%, a difference of 0.050%), Lebanese (17.4%, a difference of 0.070%), and Immigrants from Cameroon (17.4%, a difference of 0.18%).
| Demographics | Rating | Rank | Child Poverty Under the Age of 5 |
| Immigrants | Saudi Arabia | 50.0 /100 | #174 | Average 17.2% |
| Immigrants | Lebanon | 47.6 /100 | #175 | Average 17.3% |
| Immigrants | Iraq | 45.2 /100 | #176 | Average 17.3% |
| Immigrants | Sierra Leone | 43.6 /100 | #177 | Average 17.3% |
| Immigrants | Cameroon | 42.7 /100 | #178 | Average 17.4% |
| Hawaiians | 41.5 /100 | #179 | Average 17.4% |
| South American Indians | 41.4 /100 | #180 | Average 17.4% |
| Immigrants | Germany | 41.0 /100 | #181 | Average 17.4% |
| Arabs | 40.7 /100 | #182 | Average 17.4% |
| Lebanese | 40.3 /100 | #183 | Average 17.4% |
| Immigrants | Costa Rica | 39.0 /100 | #184 | Fair 17.4% |
| Immigrants | Armenia | 38.0 /100 | #185 | Fair 17.5% |
| Immigrants | Bosnia and Herzegovina | 35.0 /100 | #186 | Fair 17.5% |
| Kenyans | 34.7 /100 | #187 | Fair 17.5% |
| Carpatho Rusyns | 33.6 /100 | #188 | Fair 17.5% |
Demographics Similar to Houma by Child Poverty Under the Age of 5
In terms of child poverty under the age of 5, the demographic groups most similar to Houma are Immigrants from Dominica (22.7%, a difference of 0.14%), Immigrants from Bahamas (22.7%, a difference of 0.18%), African (22.8%, a difference of 0.41%), Seminole (22.8%, a difference of 0.45%), and Honduran (23.0%, a difference of 1.1%).
| Demographics | Rating | Rank | Child Poverty Under the Age of 5 |
| Iroquois | 0.0 /100 | #302 | Tragic 22.0% |
| Inupiat | 0.0 /100 | #303 | Tragic 22.0% |
| Immigrants | Guatemala | 0.0 /100 | #304 | Tragic 22.0% |
| Immigrants | Mexico | 0.0 /100 | #305 | Tragic 22.2% |
| Indonesians | 0.0 /100 | #306 | Tragic 22.3% |
| Immigrants | Bahamas | 0.0 /100 | #307 | Tragic 22.7% |
| Immigrants | Dominica | 0.0 /100 | #308 | Tragic 22.7% |
| Houma | 0.0 /100 | #309 | Tragic 22.7% |
| Africans | 0.0 /100 | #310 | Tragic 22.8% |
| Seminole | 0.0 /100 | #311 | Tragic 22.8% |
| Hondurans | 0.0 /100 | #312 | Tragic 23.0% |
| Bahamians | 0.0 /100 | #313 | Tragic 23.0% |
| U.S. Virgin Islanders | 0.0 /100 | #314 | Tragic 23.0% |
| Arapaho | 0.0 /100 | #315 | Tragic 23.1% |
| Yakama | 0.0 /100 | #316 | Tragic 23.1% |