Immigrants from Europe vs Dutch Receiving Food Stamps
COMPARE
Immigrants from Europe
Dutch
Receiving Food Stamps
Receiving Food Stamps Comparison
Immigrants from Europe
Dutch
10.3%
RECEIVING FOOD STAMPS
96.8/ 100
METRIC RATING
102nd/ 347
METRIC RANK
10.0%
RECEIVING FOOD STAMPS
98.6/ 100
METRIC RATING
83rd/ 347
METRIC RANK
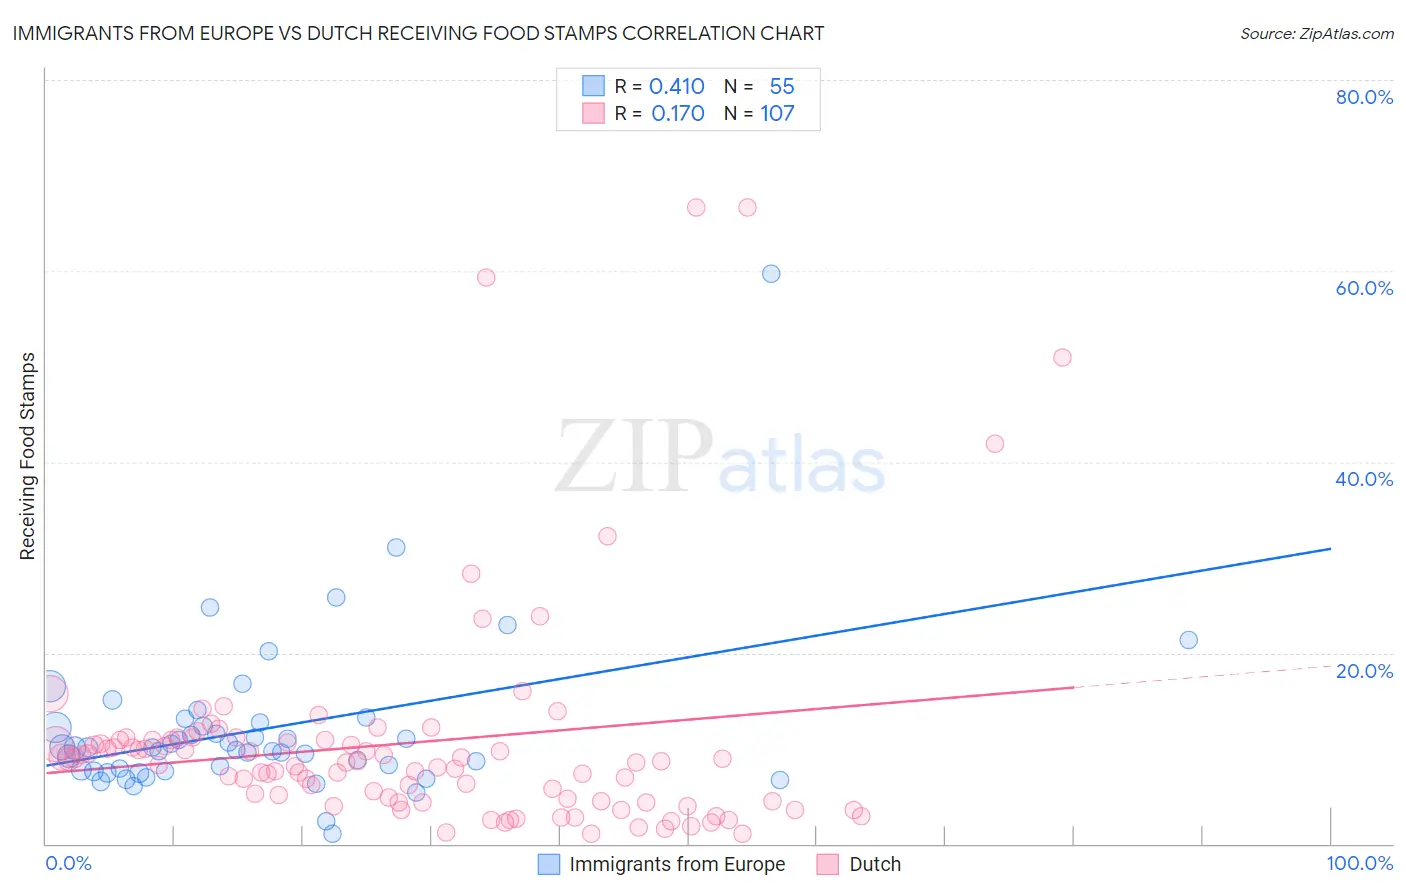
Immigrants from Europe vs Dutch Receiving Food Stamps Correlation Chart
The statistical analysis conducted on geographies consisting of 544,262,616 people shows a moderate positive correlation between the proportion of Immigrants from Europe and percentage of population receiving government assistance and/or food stamps in the United States with a correlation coefficient (R) of 0.410 and weighted average of 10.3%. Similarly, the statistical analysis conducted on geographies consisting of 551,299,483 people shows a poor positive correlation between the proportion of Dutch and percentage of population receiving government assistance and/or food stamps in the United States with a correlation coefficient (R) of 0.170 and weighted average of 10.0%, a difference of 3.3%.
Receiving Food Stamps Correlation Summary
| Measurement | Immigrants from Europe | Dutch |
| Minimum | 1.1% | 0.99% |
| Maximum | 59.7% | 66.7% |
| Range | 58.6% | 65.7% |
| Mean | 12.0% | 10.6% |
| Median | 10.0% | 8.5% |
| Interquartile 25% (IQ1) | 7.6% | 4.5% |
| Interquartile 75% (IQ3) | 12.7% | 10.8% |
| Interquartile Range (IQR) | 5.1% | 6.3% |
| Standard Deviation (Sample) | 8.6% | 11.8% |
| Standard Deviation (Population) | 8.5% | 11.7% |
Demographics Similar to Immigrants from Europe and Dutch by Receiving Food Stamps
In terms of receiving food stamps, the demographic groups most similar to Immigrants from Europe are Immigrants from Western Europe (10.3%, a difference of 0.090%), Palestinian (10.3%, a difference of 0.090%), Serbian (10.3%, a difference of 0.21%), Immigrants from Egypt (10.3%, a difference of 0.39%), and Czechoslovakian (10.3%, a difference of 0.44%). Similarly, the demographic groups most similar to Dutch are Austrian (10.0%, a difference of 0.0%), Immigrants from Israel (10.0%, a difference of 0.070%), Immigrants from Romania (10.0%, a difference of 0.25%), Immigrants from Norway (10.0%, a difference of 0.35%), and Egyptian (10.0%, a difference of 0.38%).
| Demographics | Rating | Rank | Receiving Food Stamps |
| Austrians | 98.6 /100 | #82 | Exceptional 10.0% |
| Dutch | 98.6 /100 | #83 | Exceptional 10.0% |
| Immigrants | Israel | 98.5 /100 | #84 | Exceptional 10.0% |
| Immigrants | Romania | 98.5 /100 | #85 | Exceptional 10.0% |
| Immigrants | Norway | 98.4 /100 | #86 | Exceptional 10.0% |
| Egyptians | 98.4 /100 | #87 | Exceptional 10.0% |
| Immigrants | Kuwait | 98.4 /100 | #88 | Exceptional 10.0% |
| Immigrants | France | 98.3 /100 | #89 | Exceptional 10.1% |
| Finns | 97.9 /100 | #90 | Exceptional 10.2% |
| Jordanians | 97.9 /100 | #91 | Exceptional 10.2% |
| Irish | 97.9 /100 | #92 | Exceptional 10.2% |
| Belgians | 97.7 /100 | #93 | Exceptional 10.2% |
| Immigrants | Greece | 97.4 /100 | #94 | Exceptional 10.3% |
| Basques | 97.4 /100 | #95 | Exceptional 10.3% |
| Welsh | 97.3 /100 | #96 | Exceptional 10.3% |
| Czechoslovakians | 97.2 /100 | #97 | Exceptional 10.3% |
| Immigrants | Egypt | 97.1 /100 | #98 | Exceptional 10.3% |
| Serbians | 97.0 /100 | #99 | Exceptional 10.3% |
| Immigrants | Western Europe | 96.9 /100 | #100 | Exceptional 10.3% |
| Palestinians | 96.9 /100 | #101 | Exceptional 10.3% |
| Immigrants | Europe | 96.8 /100 | #102 | Exceptional 10.3% |