Immigrants from Europe vs Croatian Single Male Poverty
COMPARE
Immigrants from Europe
Croatian
Single Male Poverty
Single Male Poverty Comparison
Immigrants from Europe
Croatians
12.2%
SINGLE MALE POVERTY
97.0/ 100
METRIC RATING
102nd/ 347
METRIC RANK
12.8%
SINGLE MALE POVERTY
48.9/ 100
METRIC RATING
175th/ 347
METRIC RANK
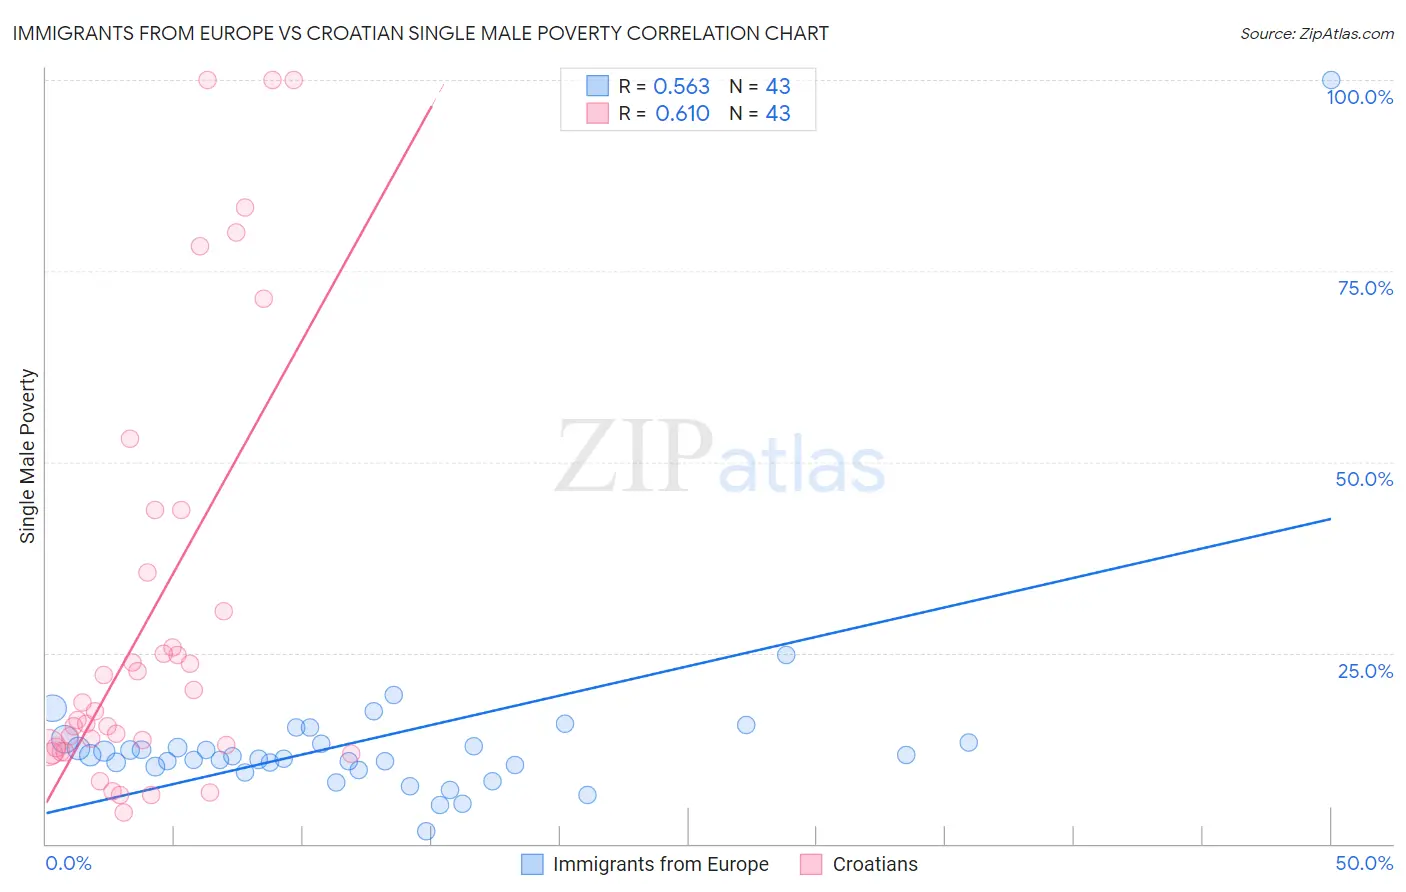
Immigrants from Europe vs Croatian Single Male Poverty Correlation Chart
The statistical analysis conducted on geographies consisting of 459,031,824 people shows a substantial positive correlation between the proportion of Immigrants from Europe and poverty level among single males in the United States with a correlation coefficient (R) of 0.563 and weighted average of 12.2%. Similarly, the statistical analysis conducted on geographies consisting of 328,638,760 people shows a significant positive correlation between the proportion of Croatians and poverty level among single males in the United States with a correlation coefficient (R) of 0.610 and weighted average of 12.8%, a difference of 4.9%.
Single Male Poverty Correlation Summary
| Measurement | Immigrants from Europe | Croatian |
| Minimum | 1.6% | 4.2% |
| Maximum | 100.0% | 100.0% |
| Range | 98.4% | 95.8% |
| Mean | 13.7% | 29.9% |
| Median | 11.5% | 17.3% |
| Interquartile 25% (IQ1) | 10.1% | 12.5% |
| Interquartile 75% (IQ3) | 13.3% | 35.6% |
| Interquartile Range (IQR) | 3.2% | 23.0% |
| Standard Deviation (Sample) | 14.1% | 28.1% |
| Standard Deviation (Population) | 13.9% | 27.7% |
Similar Demographics by Single Male Poverty
Demographics Similar to Immigrants from Europe by Single Male Poverty
In terms of single male poverty, the demographic groups most similar to Immigrants from Europe are Immigrants from Latvia (12.2%, a difference of 0.010%), Immigrants from Australia (12.2%, a difference of 0.040%), Immigrants from Armenia (12.2%, a difference of 0.14%), Immigrants from Kazakhstan (12.2%, a difference of 0.14%), and Immigrants from Cuba (12.2%, a difference of 0.16%).
| Demographics | Rating | Rank | Single Male Poverty |
| Mongolians | 97.7 /100 | #95 | Exceptional 12.2% |
| Immigrants | Sweden | 97.5 /100 | #96 | Exceptional 12.2% |
| Immigrants | Italy | 97.4 /100 | #97 | Exceptional 12.2% |
| Guamanians/Chamorros | 97.4 /100 | #98 | Exceptional 12.2% |
| Immigrants | Cuba | 97.3 /100 | #99 | Exceptional 12.2% |
| Immigrants | Australia | 97.1 /100 | #100 | Exceptional 12.2% |
| Immigrants | Latvia | 97.0 /100 | #101 | Exceptional 12.2% |
| Immigrants | Europe | 97.0 /100 | #102 | Exceptional 12.2% |
| Immigrants | Armenia | 96.7 /100 | #103 | Exceptional 12.2% |
| Immigrants | Kazakhstan | 96.7 /100 | #104 | Exceptional 12.2% |
| Jordanians | 95.9 /100 | #105 | Exceptional 12.3% |
| Immigrants | Morocco | 95.6 /100 | #106 | Exceptional 12.3% |
| Iraqis | 95.1 /100 | #107 | Exceptional 12.3% |
| Immigrants | Eastern Africa | 95.0 /100 | #108 | Exceptional 12.3% |
| Ugandans | 94.5 /100 | #109 | Exceptional 12.3% |
Demographics Similar to Croatians by Single Male Poverty
In terms of single male poverty, the demographic groups most similar to Croatians are Syrian (12.8%, a difference of 0.020%), Costa Rican (12.8%, a difference of 0.060%), Immigrants from St. Vincent and the Grenadines (12.8%, a difference of 0.11%), South African (12.8%, a difference of 0.14%), and Danish (12.8%, a difference of 0.14%).
| Demographics | Rating | Rank | Single Male Poverty |
| Immigrants | Barbados | 57.7 /100 | #168 | Average 12.7% |
| Puget Sound Salish | 54.3 /100 | #169 | Average 12.8% |
| Guyanese | 52.0 /100 | #170 | Average 12.8% |
| South Africans | 51.5 /100 | #171 | Average 12.8% |
| Danes | 51.4 /100 | #172 | Average 12.8% |
| Immigrants | St. Vincent and the Grenadines | 50.9 /100 | #173 | Average 12.8% |
| Costa Ricans | 50.0 /100 | #174 | Average 12.8% |
| Croatians | 48.9 /100 | #175 | Average 12.8% |
| Syrians | 48.4 /100 | #176 | Average 12.8% |
| Immigrants | Canada | 44.8 /100 | #177 | Average 12.8% |
| Immigrants | Switzerland | 43.1 /100 | #178 | Average 12.8% |
| Israelis | 41.0 /100 | #179 | Average 12.9% |
| Immigrants | North America | 37.7 /100 | #180 | Fair 12.9% |
| Panamanians | 37.6 /100 | #181 | Fair 12.9% |
| Moroccans | 36.8 /100 | #182 | Fair 12.9% |